Last official estimated population of Pismo Beach city (San Luis Obispo County**, California state) was 7,931 (year 2014)[1]. This was 0.002% of total US population and 0.02% of total California state population. Area of Pismo Beach city is 13.5 mi² (=34.9 km²)[6], in this year population density was 588.53 p/mi². If population growth rate would be same as in period 2010-2014 (+0.89%/yr), Pismo Beach city population in 2026 would be 8,820*.
Historical population of Pismo Beach city for period 1950-2014:
Estimated population for 2014[1]. Click on flag to hide it.
Population • Legends • Position

[1950-1960] +2.15 %/yr
[1960-1970] +8.66 %/yr
[1970-1980] +2.87 %/yr
[1980-1990] +3.73 %/yr
[1990-2000] +0.97 %/yr
[2000-2005] -1.13 %/yr
[2005-2010] -1.01 %/yr
[2010-2014] +0.89 %/yr
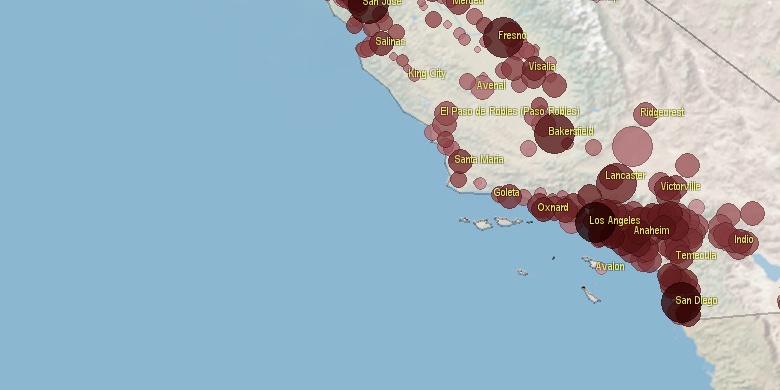
• Santa Maria city population
20 mi,  139°
139°
• San Luis Obispo city
7.7 mi,  4°
4°
• Lompoc city
35.8 mi,  161°
161°
• El Paso de Robles (Paso Robles) city
33.7 mi, 1°
• Atascadero city
23 mi,  357°
357°
• Arroyo Grande city
5.4 mi,  111°
111°
• Grover Beach city
3.8 mi,  125°
125°
• Morro Bay city
18.4 mi,  323°
323°
• Guadalupe city
14.4 mi, 156°
• Buellton city
46.1 mi, 143°
*Calculated by population.us from last known population growth rate, not official data.
**Some cities are placed on more than one county. Only 1 county is shown.
[1] Cities and Towns (Incorporated Places and Minor Civil Divisions) 2014, archived from the original, retrieved 02/23/2016
[2] City and Town Intercensal Estimates (2000-2010), archived from the original, retrieved 02/23/2016
[3] Places: 1990 and 1999 Populations, With Numeric and Percent Population Change, archived from the original, retrieved 02/23/2016
[4] Population of the 100 Largest Urban Places: 1980,
[5] Population of the 100 Largest Urban Places in history,
[6] Area, latitude longitude data, retrieved 02/23/2016
[7] Through the Decades, Overview 1790-2010, PDF, large files! >100 Mb
Page generated in 0.009 seconds© 2016 population.us | Terms of use | Contact