Last official estimated population of Marion County was 30,810 (year 2014)[1]. This was 0.01% of total US population and 0.6% of total Alabama state population. Area of Marion County is 743.6 mi² (=1925.8 km²), in this year population density was 41.44 p/mi². If population growth rate would be same as in period 2010-2014 (+0.03%/yr), Marion County population in 2026 would be 30,912 [0].
Historical population of Marion County for period 1830-2014 [1] , [2] , [3]:
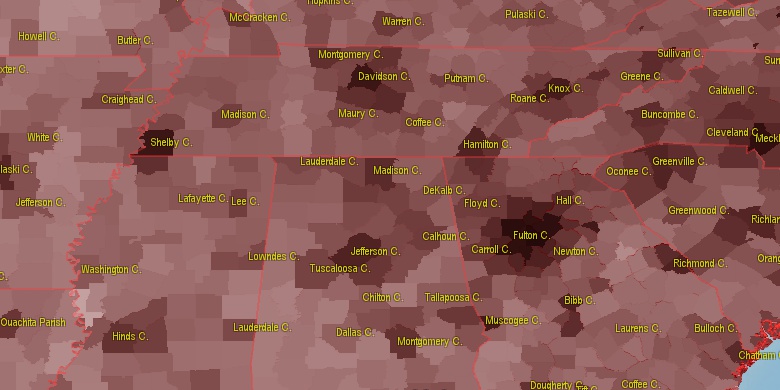
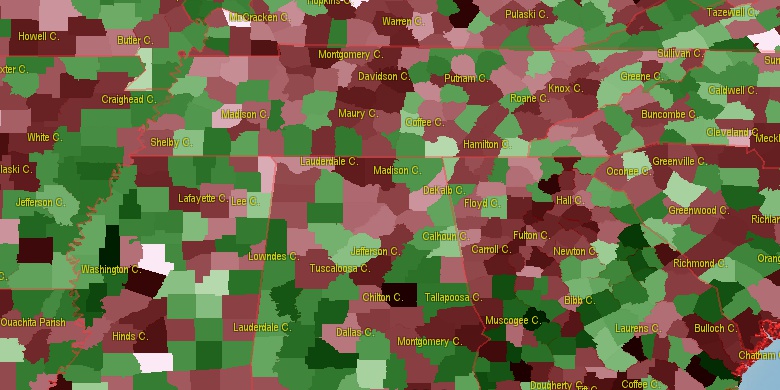
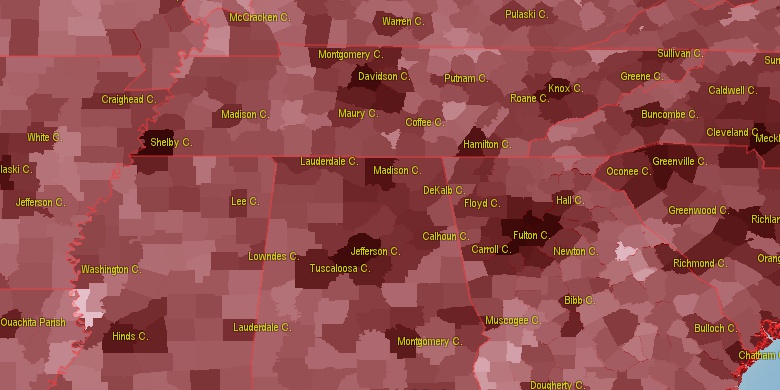
Estimated population for 2014[1]. Population density is in p./sq.mi [4]. Changes are for period 2010-2015. Value is %/year. Boundary lines are approx. 2012 [5]. Click on flag to hide it.
Population • Density • Changes • Legends • Position

[1830-1840] +3.72 %/yr
[1840-1850] +2.97 %/yr
[1850-1860] +3.62 %/yr
[1860-1870] -5.94 %/yr
[1870-1880] +4.45 %/yr
[1880-1890] +1.94 %/yr
[1890-1900] +2.48 %/yr
[1900-1910] +1.9 %/yr
[1910-1920] +2.32 %/yr
[1920-1930] +1.67 %/yr
[1930-1940] +1.03 %/yr
[1940-1950] -0.54 %/yr
[1950-1960] -2.2 %/yr
[1960-1970] +0.86 %/yr
[1970-1980] +2.36 %/yr
[1980-1990] -0.07 %/yr
[1990-2000] +0.44 %/yr
[2000-2005] -0.43 %/yr
[2005-2010] +0.18 %/yr
[2010-2014] +0.03 %/yr
Looking for settlements in Marion County? Visit this page: Settlements in Marion County, AL
Population of Marion County by age groups male (M) and female (F)[1b]
| Age Gr. | (M) | (F) | Total |
| 0 to 4 | 850 | 772 | 1,622 |
| 5 to 9 | 872 | 807 | 1,679 |
| 10 to 14 | 1007 | 913 | 1,920 |
| 15 to 19 | 958 | 828 | 1,786 |
| 20 to 24 | 857 | 845 | 1,702 |
| 25 to 29 | 806 | 811 | 1,617 |
| 30 to 34 | 836 | 858 | 1,694 |
| 35 to 39 | 838 | 822 | 1,660 |
| 40 to 44 | 1037 | 988 | 2,025 |
| 45 to 49 | 1072 | 1040 | 2,112 |
| 50 to 54 | 1144 | 1105 | 2,249 |
| 55 to 59 | 1057 | 1051 | 2,108 |
| 60 to 64 | 973 | 1029 | 2,002 |
| 65 to 69 | 943 | 1003 | 1,946 |
| 70 to 74 | 723 | 831 | 1,554 |
| 75 to 79 | 546 | 686 | 1,232 |
| 80 to 84 | 269 | 418 | 687 |
| 85+ | 226 | 450 | 676 |
Marion County resident population estimates by Sex, Race, and Hispanic Origin[1b]. For full list of abbrevations see: population.us/about page.
| Race | Male | Female | Total |
| NH | 14591 | 14938 | 29,529 |
| WAC | 14135 | 14628 | 28,763 |
| WA | 13962 | 14460 | 28,422 |
| NHWAC | 13743 | 14332 | 28,075 |
| NHWA | 13583 | 14184 | 27,767 |
| BAC | 859 | 568 | 1,427 |
| NHBAC | 835 | 555 | 1,390 |
| BA | 770 | 506 | 1,276 |
| NHBA | 752 | 499 | 1,251 |
| H | 423 | 319 | 742 |
| HWAC | 392 | 296 | 688 |
| HWA | 379 | 276 | 655 |
| TOM | 186 | 176 | 362 |
| NHTOM | 172 | 155 | 327 |
| IAC | 141 | 145 | 286 |
| NHIAC | 129 | 130 | 259 |
| AAC | 48 | 76 | 124 |
| NHAAC | 44 | 68 | 112 |
| IA | 53 | 52 | 105 |
| NHIA | 48 | 47 | 95 |
| AA | 34 | 52 | 86 |
| NHAA | 31 | 49 | 80 |
| HBAC | 24 | 13 | 37 |
| NAC | 18 | 17 | 35 |
| HTOM | 14 | 21 | 35 |
| HIAC | 12 | 15 | 27 |
| HBA | 18 | 7 | 25 |
| NHNAC | 13 | 8 | 21 |
| NA | 9 | 11 | 20 |
| HNAC | 5 | 9 | 14 |
| HAAC | 4 | 8 | 12 |
| HNA | 4 | 7 | 11 |
| HIA | 5 | 5 | 10 |
| NHNA | 5 | 4 | 9 |
| HAA | 3 | 3 | 6 |
• Walker County population
41 mi,  125°
125°
• Colbert County
39.3 mi,  6°
6°
• Monroe County
38.6 mi,  243°
243°
• Lawrence County
41.9 mi,  49°
49°
• Franklin County
21.1 mi, 6°
• Winston County
29.5 mi,  87°
87°
• Itawamba County
29.2 mi,  289°
289°
• Tishomingo County
46.1 mi,  334°
334°
• Fayette County
29.9 mi,  167°
167°
• Lamar County
27 mi,  205°
205°
[0] Calculated by population.us from last known population growth rate, not official data.
[1] County population - 2014, archived from the original, retrieved 02/23/2016
[1b] Annual County Resident Population Estimates by Age, Sex, Race, and Hispanic Origin, (used only data for 2014) archived from the original, retrieved 02/23/2016
[2] County population - 2000-2010, archived from the original, retrieved 02/23/2016
[3] Population of States and Counties of the United States: 1790 to 1992, PDF, 15 Mb, census.gov, retrieved 02/23/2016
[4] County area, latitude longitude data, retrieved 02/23/2016
[5] County boundaries, CSV files on boundaries.us, retrived 03/18/2016
Page generated in 0.008 seconds© 2016 population.us | Terms of use | Contact