Last official estimated population of Mariposa County was 18,261 (year 2014)[1]. This was 0.006% of total US population and 0% of total California state population. Area of Mariposa County is 1,462.8 mi² (=3788.7 km²), in this year population density was 12.48 p/mi². If population growth rate would be same as in period 2010-2014 (+0.01%/yr), Mariposa County population in 2026 would be 18,291 [0].
Historical population of Mariposa County for period 1850-2014 [1] , [2] , [3]:
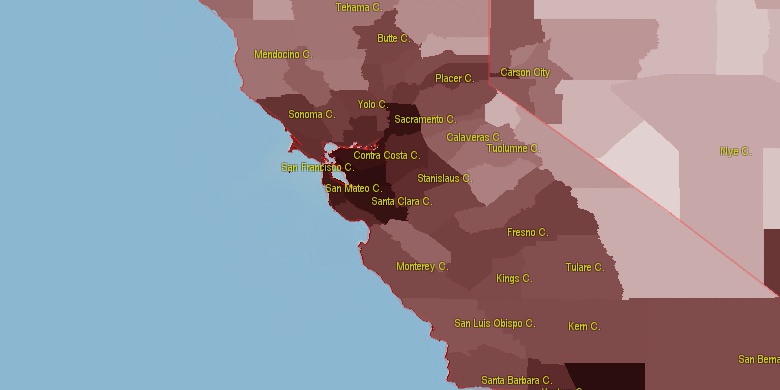
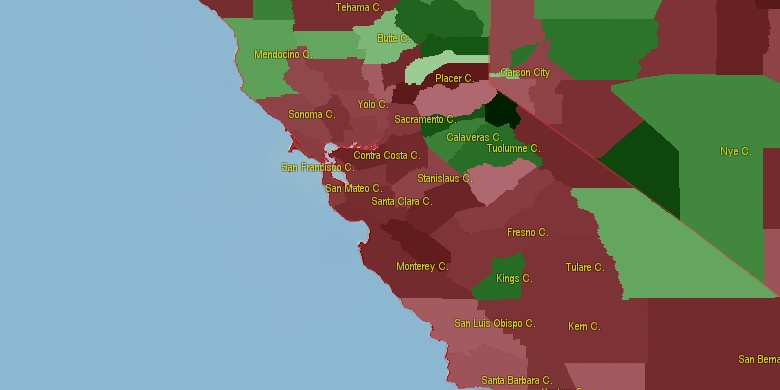
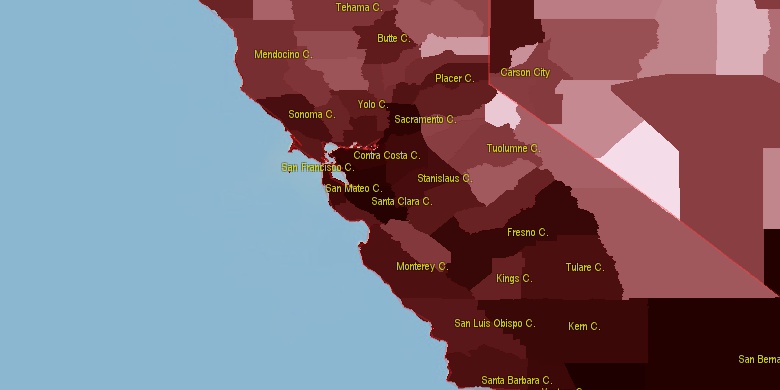
Estimated population for 2014[1]. Population density is in p./sq.mi [4]. Changes are for period 2010-2015. Value is %/year. Boundary lines are approx. 2012 [5]. Click on flag to hide it.
Population • Density • Changes • Legends • Position

[1850-1860] +3.61 %/yr
[1860-1870] -3.07 %/yr
[1870-1880] -0.52 %/yr
[1880-1890] -1.35 %/yr
[1890-1900] +2.23 %/yr
[1900-1910] -1.75 %/yr
[1910-1920] -3.48 %/yr
[1920-1930] +1.54 %/yr
[1930-1940] +5.66 %/yr
[1940-1950] -0.85 %/yr
[1950-1960] -0.16 %/yr
[1960-1970] +1.74 %/yr
[1970-1980] +6.33 %/yr
[1980-1990] +2.56 %/yr
[1990-2000] +1.81 %/yr
[2000-2005] +0.99 %/yr
[2005-2010] +0.31 %/yr
[2010-2014] +0.01 %/yr
Looking for settlements in Mariposa County? Visit this page: Settlements in Mariposa County, CA
Population of Mariposa County by age groups male (M) and female (F)[1b]
| Age Gr. | (M) | (F) | Total |
| 0 to 4 | 384 | 393 | 777 |
| 5 to 9 | 395 | 397 | 792 |
| 10 to 14 | 445 | 373 | 818 |
| 15 to 19 | 445 | 446 | 891 |
| 20 to 24 | 472 | 426 | 898 |
| 25 to 29 | 461 | 412 | 873 |
| 30 to 34 | 454 | 403 | 857 |
| 35 to 39 | 379 | 364 | 743 |
| 40 to 44 | 433 | 395 | 828 |
| 45 to 49 | 499 | 508 | 1,007 |
| 50 to 54 | 753 | 740 | 1,493 |
| 55 to 59 | 857 | 868 | 1,725 |
| 60 to 64 | 814 | 830 | 1,644 |
| 65 to 69 | 784 | 680 | 1,464 |
| 70 to 74 | 559 | 548 | 1,107 |
| 75 to 79 | 402 | 367 | 769 |
| 80 to 84 | 254 | 260 | 514 |
| 85+ | 196 | 286 | 482 |
Mariposa County resident population estimates by Sex, Race, and Hispanic Origin[1b]. For full list of abbrevations see: population.us/about page.
| Race | Male | Female | Total |
| WAC | 8377 | 8180 | 16,557 |
| WA | 8064 | 7862 | 15,926 |
| NH | 8062 | 7792 | 15,854 |
| NHWAC | 7541 | 7355 | 14,896 |
| NHWA | 7289 | 7110 | 14,399 |
| H | 924 | 904 | 1,828 |
| HWAC | 836 | 825 | 1,661 |
| HWA | 775 | 752 | 1,527 |
| IAC | 515 | 473 | 988 |
| NHIAC | 422 | 365 | 787 |
| TOM | 333 | 338 | 671 |
| IA | 328 | 273 | 601 |
| NHTOM | 269 | 265 | 534 |
| NHIA | 270 | 208 | 478 |
| AAC | 182 | 191 | 373 |
| BAC | 208 | 154 | 362 |
| NHAAC | 164 | 180 | 344 |
| NHBAC | 173 | 126 | 299 |
| AA | 117 | 139 | 256 |
| NHAA | 108 | 135 | 243 |
| HIAC | 93 | 108 | 201 |
| BA | 127 | 71 | 198 |
| NHBA | 111 | 63 | 174 |
| HTOM | 64 | 73 | 137 |
| HIA | 58 | 65 | 123 |
| NAC | 40 | 38 | 78 |
| NHNAC | 34 | 33 | 67 |
| HBAC | 35 | 28 | 63 |
| NA | 17 | 13 | 30 |
| HAAC | 18 | 11 | 29 |
| NHNA | 15 | 11 | 26 |
| HBA | 16 | 8 | 24 |
| HAA | 9 | 4 | 13 |
| HNAC | 6 | 5 | 11 |
| HNA | 2 | 2 | 4 |
• Fresno County population
57.7 mi,  165°
165°
• San Joaquin County
78.4 mi,  288°
288°
• Stanislaus County
59.7 mi,  269°
269°
• Merced County
51.5 mi,  239°
239°
• Madera County
26.4 mi,  160°
160°
• Tuolumne County
31.3 mi,  354°
354°
• Calaveras County
55.2 mi,  320°
320°
• Amador County
72.6 mi,  326°
326°
• Mono County
61.5 mi,  67°
67°
• Alpine County
72.9 mi,  4°
4°
[0] Calculated by population.us from last known population growth rate, not official data.
[1] County population - 2014, archived from the original, retrieved 02/23/2016
[1b] Annual County Resident Population Estimates by Age, Sex, Race, and Hispanic Origin, (used only data for 2014) archived from the original, retrieved 02/23/2016
[2] County population - 2000-2010, archived from the original, retrieved 02/23/2016
[3] Population of States and Counties of the United States: 1790 to 1992, PDF, 15 Mb, census.gov, retrieved 02/23/2016
[4] County area, latitude longitude data, retrieved 02/23/2016
[5] County boundaries, CSV files on boundaries.us, retrived 03/18/2016
Page generated in 0.011 seconds© 2016 population.us | Terms of use | Contact