Last official estimated population of Madison County was 19,255 (year 2014)[1]. This was 0.006% of total US population and 0.1% of total Florida state population. Area of Madison County is 715.7 mi² (=1853.6 km²), in this year population density was 26.90 p/mi². If population growth rate would be same as in period 2010-2014 (+0.04%/yr), Madison County population in 2026 would be 19,348 [0].
Historical population of Madison County for period 1830-2014 [1] , [2] , [3]:
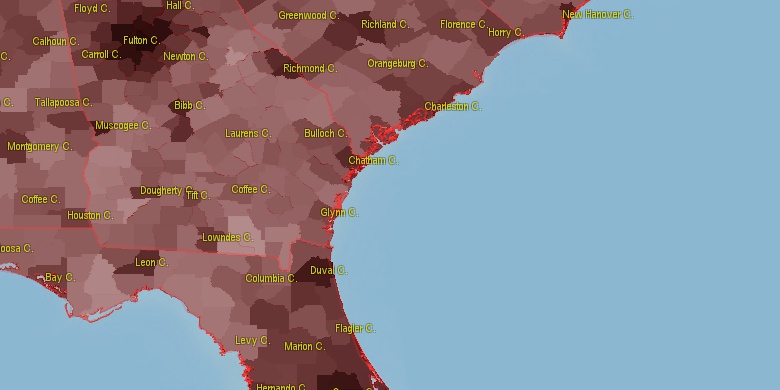
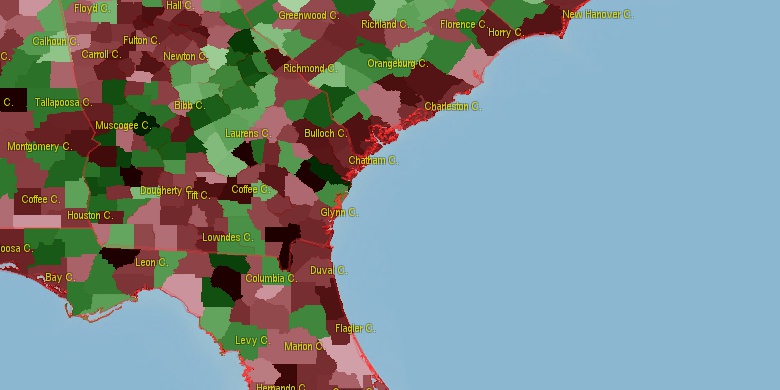
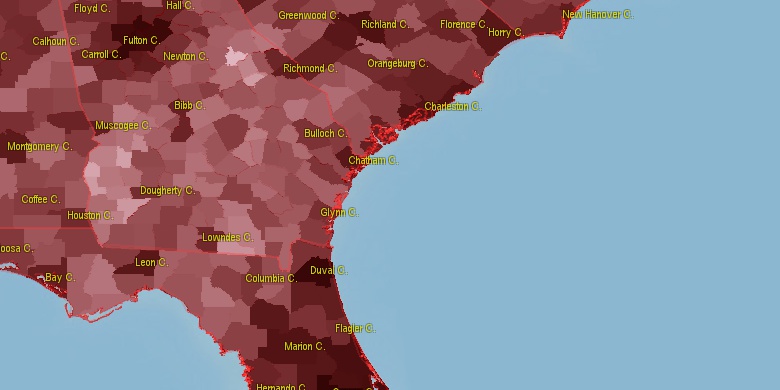
Estimated population for 2014[1]. Population density is in p./sq.mi [4]. Changes are for period 2010-2015. Value is %/year. Boundary lines are approx. 2012 [5]. Click on flag to hide it.
Population • Density • Changes • Legends • Position

[1830-1840] +17.55 %/yr
[1840-1850] +7.58 %/yr
[1850-1860] +3.55 %/yr
[1860-1870] +3.64 %/yr
[1870-1880] +2.9 %/yr
[1880-1890] -0.33 %/yr
[1890-1900] +0.76 %/yr
[1900-1910] +0.92 %/yr
[1910-1920] -0.24 %/yr
[1920-1930] -0.56 %/yr
[1930-1940] +0.36 %/yr
[1940-1950] -1.31 %/yr
[1950-1960] -0.03 %/yr
[1960-1970] -0.49 %/yr
[1970-1980] +1 %/yr
[1980-1990] +1.07 %/yr
[1990-2000] +1.23 %/yr
[2000-2005] +0.37 %/yr
[2005-2010] +0.16 %/yr
[2010-2014] +0.04 %/yr
Looking for settlements in Madison County? Visit this page: Settlements in Madison County, FL
Population of Madison County by age groups male (M) and female (F)[1b]
| Age Gr. | (M) | (F) | Total |
| 0 to 4 | 533 | 478 | 1,011 |
| 5 to 9 | 546 | 530 | 1,076 |
| 10 to 14 | 457 | 480 | 937 |
| 15 to 19 | 579 | 432 | 1,011 |
| 20 to 24 | 747 | 543 | 1,290 |
| 25 to 29 | 722 | 501 | 1,223 |
| 30 to 34 | 682 | 517 | 1,199 |
| 35 to 39 | 611 | 442 | 1,053 |
| 40 to 44 | 663 | 502 | 1,165 |
| 45 to 49 | 706 | 563 | 1,269 |
| 50 to 54 | 692 | 628 | 1,320 |
| 55 to 59 | 635 | 659 | 1,294 |
| 60 to 64 | 656 | 701 | 1,357 |
| 65 to 69 | 591 | 527 | 1,118 |
| 70 to 74 | 386 | 435 | 821 |
| 75 to 79 | 291 | 304 | 595 |
| 80 to 84 | 160 | 231 | 391 |
| 85+ | 115 | 273 | 388 |
Madison County resident population estimates by Sex, Race, and Hispanic Origin[1b]. For full list of abbrevations see: population.us/about page.
| Race | Male | Female | Total |
| NH | 9161 | 8440 | 17,601 |
| WAC | 5868 | 5245 | 11,113 |
| WA | 5758 | 5118 | 10,876 |
| NHWAC | 5326 | 4976 | 10,302 |
| NHWA | 5229 | 4857 | 10,086 |
| BAC | 3856 | 3475 | 7,331 |
| NHBAC | 3810 | 3444 | 7,254 |
| BA | 3788 | 3408 | 7,196 |
| NHBA | 3749 | 3381 | 7,130 |
| H | 611 | 306 | 917 |
| HWAC | 542 | 269 | 811 |
| HWA | 529 | 261 | 790 |
| TOM | 118 | 135 | 253 |
| NHTOM | 103 | 127 | 230 |
| IAC | 116 | 90 | 206 |
| NHIAC | 86 | 80 | 166 |
| IA | 78 | 41 | 119 |
| AAC | 42 | 56 | 98 |
| NHAAC | 36 | 53 | 89 |
| NHIA | 53 | 33 | 86 |
| HBAC | 46 | 31 | 77 |
| AA | 29 | 43 | 72 |
| NHAA | 26 | 41 | 67 |
| HBA | 39 | 27 | 66 |
| HIAC | 30 | 10 | 40 |
| HIA | 25 | 8 | 33 |
| HTOM | 15 | 8 | 23 |
| NAC | 8 | 15 | 23 |
| NHNAC | 6 | 14 | 20 |
| HAAC | 6 | 3 | 9 |
| HAA | 3 | 2 | 5 |
| HNAC | 2 | 1 | 3 |
| NHNA | 1 | 1 | 2 |
| NA | 1 | 1 | 2 |
| HNA | 0 | 0 | 0 |
• Lowndes County population
29.2 mi,  24°
24°
• Thomas County
39.3 mi,  317°
317°
• Suwannee County
33.6 mi,  122°
122°
• Taylor County
31.3 mi,  195°
195°
• Brooks County
26.8 mi,  345°
345°
• Jefferson County
25.1 mi,  266°
266°
• Hamilton County
31.1 mi,  84°
84°
• Lanier County
47.5 mi,  30°
30°
• Lafayette County
36.1 mi,  151°
151°
• Echols County
41.8 mi,  64°
64°
[0] Calculated by population.us from last known population growth rate, not official data.
[1] County population - 2014, archived from the original, retrieved 02/23/2016
[1b] Annual County Resident Population Estimates by Age, Sex, Race, and Hispanic Origin, (used only data for 2014) archived from the original, retrieved 02/23/2016
[2] County population - 2000-2010, archived from the original, retrieved 02/23/2016
[3] Population of States and Counties of the United States: 1790 to 1992, PDF, 15 Mb, census.gov, retrieved 02/23/2016
[4] County area, latitude longitude data, retrieved 02/23/2016
[5] County boundaries, CSV files on boundaries.us, retrived 03/18/2016
Page generated in 0.013 seconds© 2016 population.us | Terms of use | Contact