Last official estimated population of Palo Alto County was 9,399 (year 2014)[1]. This was 0.003% of total US population and 0.3% of total Iowa state population. Area of Palo Alto County is 569.4 mi² (=1474.8 km²), in this year population density was 16.51 p/mi². If population growth rate would be same as in period 2010-2014 (-0.06%/yr), Palo Alto County population in 2026 would be 9,333 [0].
Historical population of Palo Alto County for period 1860-2014 [1] , [2] , [3]:
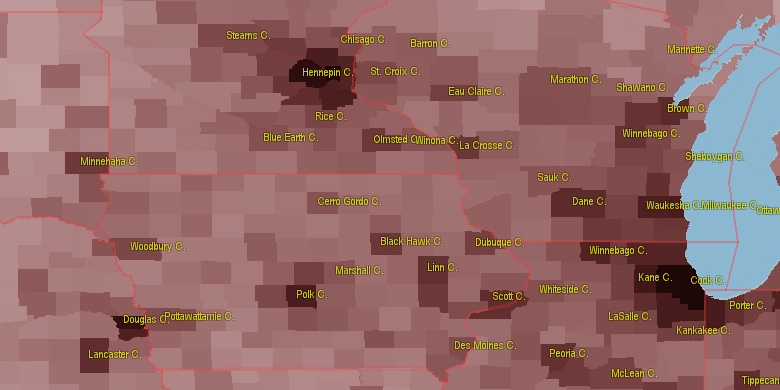
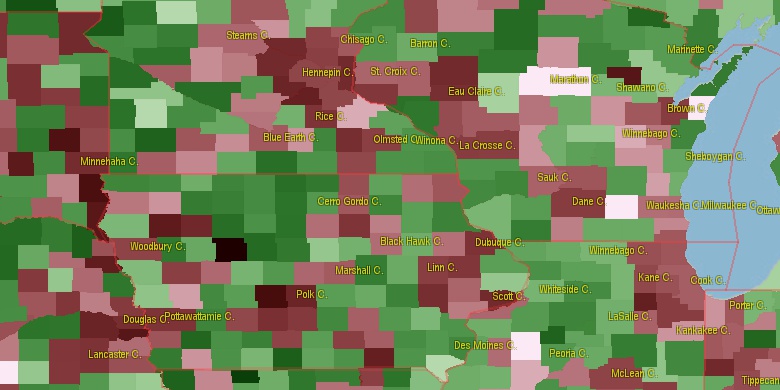
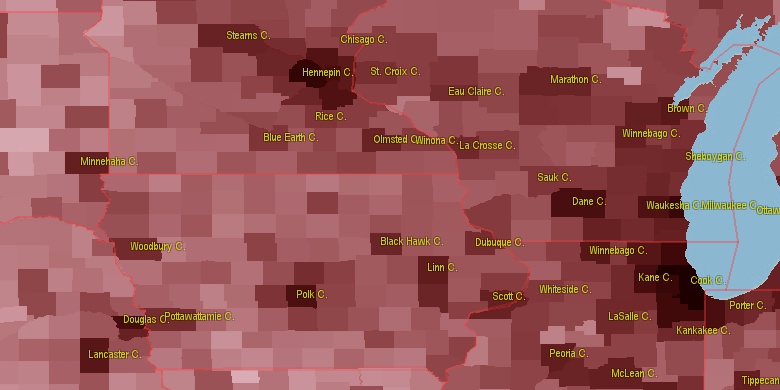
Estimated population for 2014[1]. Population density is in p./sq.mi [4]. Changes are for period 2010-2015. Value is %/year. Boundary lines are approx. 2012 [5]. Click on flag to hide it.
Population • Density • Changes • Legends • Position

[1860-1870] +26.04 %/yr
[1870-1880] +11.95 %/yr
[1880-1890] +8.47 %/yr
[1890-1900] +4.42 %/yr
[1900-1910] -0.36 %/yr
[1910-1920] +1.13 %/yr
[1920-1930] -0.06 %/yr
[1930-1940] +0.49 %/yr
[1940-1950] -0.17 %/yr
[1950-1960] -0.75 %/yr
[1960-1970] -1.03 %/yr
[1970-1980] -0.44 %/yr
[1980-1990] -1.74 %/yr
[1990-2000] -0.5 %/yr
[2000-2005] -0.89 %/yr
[2005-2010] -0.59 %/yr
[2010-2014] -0.06 %/yr
Looking for settlements in Palo Alto County? Visit this page: Settlements in Palo Alto County, IA
Population of Palo Alto County by age groups male (M) and female (F)[1b]
| Age Gr. | (M) | (F) | Total |
| 0 to 4 | 254 | 279 | 533 |
| 5 to 9 | 306 | 291 | 597 |
| 10 to 14 | 302 | 257 | 559 |
| 15 to 19 | 326 | 255 | 581 |
| 20 to 24 | 300 | 260 | 560 |
| 25 to 29 | 254 | 212 | 466 |
| 30 to 34 | 248 | 247 | 495 |
| 35 to 39 | 225 | 217 | 442 |
| 40 to 44 | 239 | 240 | 479 |
| 45 to 49 | 227 | 245 | 472 |
| 50 to 54 | 356 | 303 | 659 |
| 55 to 59 | 344 | 353 | 697 |
| 60 to 64 | 311 | 298 | 609 |
| 65 to 69 | 255 | 258 | 513 |
| 70 to 74 | 178 | 190 | 368 |
| 75 to 79 | 151 | 220 | 371 |
| 80 to 84 | 129 | 190 | 319 |
| 85+ | 121 | 258 | 379 |
Palo Alto County resident population estimates by Sex, Race, and Hispanic Origin[1b]. For full list of abbrevations see: population.us/about page.
| Race | Male | Female | Total |
| WAC | 4450 | 4478 | 8,928 |
| NH | 4431 | 4477 | 8,908 |
| WA | 4407 | 4423 | 8,830 |
| NHWAC | 4363 | 4387 | 8,750 |
| NHWA | 4320 | 4338 | 8,658 |
| H | 95 | 96 | 191 |
| HWAC | 87 | 91 | 178 |
| HWA | 87 | 85 | 172 |
| BAC | 55 | 63 | 118 |
| NHBAC | 51 | 57 | 108 |
| TOM | 44 | 58 | 102 |
| NHTOM | 44 | 52 | 96 |
| AAC | 30 | 52 | 82 |
| NHAAC | 30 | 52 | 82 |
| BA | 39 | 40 | 79 |
| NHBA | 35 | 37 | 72 |
| IAC | 31 | 38 | 69 |
| NHIAC | 28 | 33 | 61 |
| NHAA | 16 | 34 | 50 |
| AA | 16 | 34 | 50 |
| IA | 17 | 16 | 33 |
| NHIA | 14 | 14 | 28 |
| HBAC | 4 | 6 | 10 |
| NAC | 5 | 4 | 9 |
| NHNAC | 4 | 4 | 8 |
| HIAC | 3 | 5 | 8 |
| HBA | 4 | 3 | 7 |
| HTOM | 0 | 6 | 6 |
| NA | 3 | 2 | 5 |
| HIA | 3 | 2 | 5 |
| NHNA | 2 | 2 | 4 |
| HNAC | 1 | 0 | 1 |
| HNA | 1 | 0 | 1 |
| HAAC | 0 | 0 | 0 |
| HAA | 0 | 0 | 0 |
• Martin County population
42.1 mi,  9°
9°
• Buena Vista County
33.2 mi,  226°
226°
• Dickinson County
34.3 mi,  309°
309°
• Clay County
24.3 mi,  270°
270°
• Kossuth County
24.8 mi,  67°
67°
• Hancock County
46.7 mi,  89°
89°
• Emmet County
20.9 mi,  359°
359°
• Calhoun County
47.6 mi,  178°
178°
• Humboldt County
31.1 mi,  130°
130°
• Pocahontas County
23.6 mi, 181°
[0] Calculated by population.us from last known population growth rate, not official data.
[1] County population - 2014, archived from the original, retrieved 02/23/2016
[1b] Annual County Resident Population Estimates by Age, Sex, Race, and Hispanic Origin, (used only data for 2014) archived from the original, retrieved 02/23/2016
[2] County population - 2000-2010, archived from the original, retrieved 02/23/2016
[3] Population of States and Counties of the United States: 1790 to 1992, PDF, 15 Mb, census.gov, retrieved 02/23/2016
[4] County area, latitude longitude data, retrieved 02/23/2016
[5] County boundaries, CSV files on boundaries.us, retrived 03/18/2016
Page generated in 0.015 seconds© 2016 population.us | Terms of use | Contact