Last official estimated population of Bannock County was 83,000 (year 2014)[1]. This was 0.026% of total US population and 5% of total Idaho state population. Area of Bannock County is 1,147.4 mi² (=2971.8 km²), in this year population density was 72.34 p/mi². If population growth rate would be same as in period 2010-2014 (+0.05%/yr), Bannock County population in 2026 would be 83,485 [0].
Historical population of Bannock County for period 1900-2014 [1] , [2] , [3]:
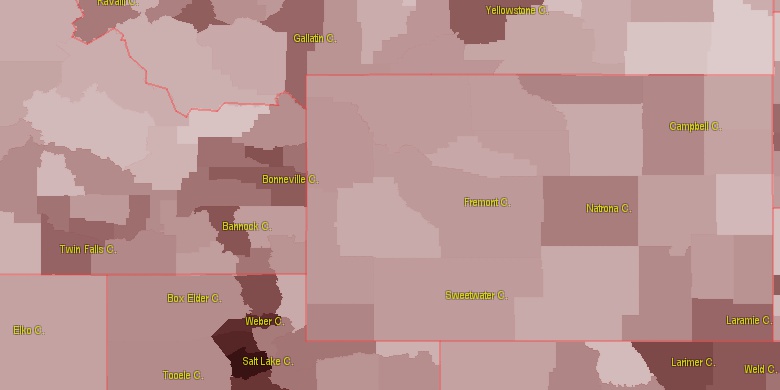
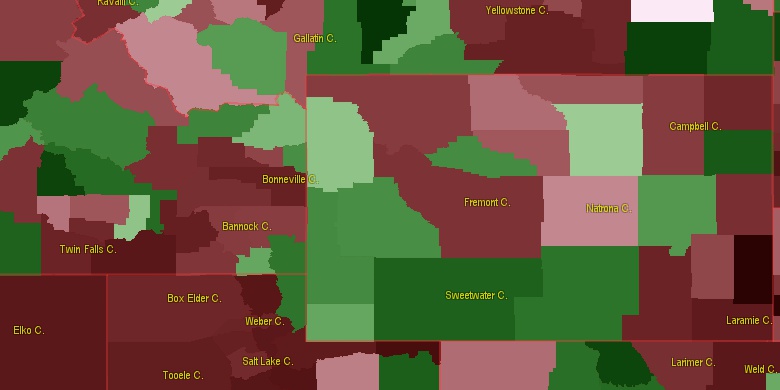
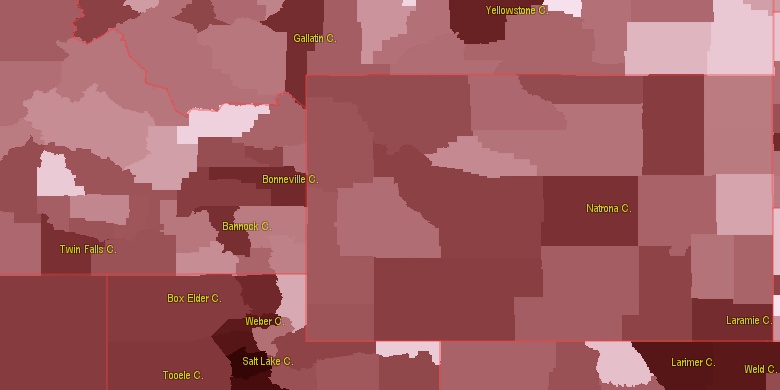
Estimated population for 2014[1]. Population density is in p./sq.mi [4]. Changes are for period 2010-2015. Value is %/year. Boundary lines are approx. 2012 [5]. Click on flag to hide it.
Population • Density • Changes • Legends • Position

[1900-1910] +5.1 %/yr
[1910-1920] +3.65 %/yr
[1920-1930] +1.28 %/yr
[1930-1940] +1.06 %/yr
[1940-1950] +1.85 %/yr
[1950-1960] +1.69 %/yr
[1960-1970] +0.56 %/yr
[1970-1980] +2.28 %/yr
[1980-1990] +0.09 %/yr
[1990-2000] +1.36 %/yr
[2000-2005] +0.49 %/yr
[2005-2010] +1.36 %/yr
[2010-2014] +0.05 %/yr
Looking for settlements in Bannock County? Visit this page: Settlements in Bannock County, ID
Population of Bannock County by age groups male (M) and female (F)[1b]
| Age Gr. | (M) | (F) | Total |
| 0 to 4 | 3030 | 3070 | 6,100 |
| 5 to 9 | 3352 | 3121 | 6,473 |
| 10 to 14 | 3190 | 2965 | 6,155 |
| 15 to 19 | 3115 | 2844 | 5,959 |
| 20 to 24 | 3207 | 3251 | 6,458 |
| 25 to 29 | 3457 | 3389 | 6,846 |
| 30 to 34 | 3097 | 3008 | 6,105 |
| 35 to 39 | 2698 | 2625 | 5,323 |
| 40 to 44 | 2206 | 2277 | 4,483 |
| 45 to 49 | 2107 | 2195 | 4,302 |
| 50 to 54 | 2317 | 2391 | 4,708 |
| 55 to 59 | 2454 | 2587 | 5,041 |
| 60 to 64 | 2356 | 2385 | 4,741 |
| 65 to 69 | 1834 | 1872 | 3,706 |
| 70 to 74 | 1202 | 1302 | 2,504 |
| 75 to 79 | 833 | 1030 | 1,863 |
| 80 to 84 | 592 | 749 | 1,341 |
| 85+ | 455 | 784 | 1,239 |
Bannock County resident population estimates by Sex, Race, and Hispanic Origin[1b]. For full list of abbrevations see: population.us/about page.
| Race | Male | Female | Total |
| WAC | 38876 | 39254 | 78,130 |
| NH | 38062 | 38619 | 76,681 |
| WA | 37954 | 38399 | 76,353 |
| NHWAC | 35885 | 36435 | 72,320 |
| NHWA | 35118 | 35721 | 70,839 |
| H | 3440 | 3226 | 6,666 |
| HWAC | 2991 | 2819 | 5,810 |
| HWA | 2836 | 2678 | 5,514 |
| IAC | 1992 | 1884 | 3,876 |
| IA | 1554 | 1490 | 3,044 |
| NHIAC | 1545 | 1468 | 3,013 |
| NHIA | 1213 | 1171 | 2,384 |
| TOM | 950 | 889 | 1,839 |
| AAC | 818 | 943 | 1,761 |
| NHAAC | 757 | 880 | 1,637 |
| NHTOM | 788 | 739 | 1,527 |
| AA | 505 | 635 | 1,140 |
| BAC | 608 | 524 | 1,132 |
| NHAA | 473 | 606 | 1,079 |
| NHBAC | 520 | 453 | 973 |
| HIAC | 447 | 416 | 863 |
| BA | 401 | 334 | 735 |
| HIA | 341 | 319 | 660 |
| NHBA | 349 | 292 | 641 |
| NAC | 232 | 181 | 413 |
| NHNAC | 198 | 165 | 363 |
| HTOM | 162 | 150 | 312 |
| NA | 138 | 98 | 236 |
| NHNA | 121 | 90 | 211 |
| HBAC | 88 | 71 | 159 |
| HAAC | 61 | 63 | 124 |
| HBA | 52 | 42 | 94 |
| HAA | 32 | 29 | 61 |
| HNAC | 34 | 16 | 50 |
| HNA | 17 | 8 | 25 |
• Cache County population
70.7 mi,  159°
159°
• Bonneville County
57.4 mi,  32°
32°
• Bingham County
37.2 mi,  346°
346°
• Jefferson County
76.4 mi,  356°
356°
• Minidoka County
72.4 mi,  279°
279°
• Franklin County
41.4 mi,  150°
150°
• Power County
31.3 mi,  270°
270°
• Caribou County
35.3 mi,  79°
79°
• Bear Lake County
53.9 mi,  121°
121°
• Oneida County
38.2 mi,  202°
202°
[0] Calculated by population.us from last known population growth rate, not official data.
[1] County population - 2014, archived from the original, retrieved 02/23/2016
[1b] Annual County Resident Population Estimates by Age, Sex, Race, and Hispanic Origin, (used only data for 2014) archived from the original, retrieved 02/23/2016
[2] County population - 2000-2010, archived from the original, retrieved 02/23/2016
[3] Population of States and Counties of the United States: 1790 to 1992, PDF, 15 Mb, census.gov, retrieved 02/23/2016
[4] County area, latitude longitude data, retrieved 02/23/2016
[5] County boundaries, CSV files on boundaries.us, retrived 03/18/2016
*Bingham Idaho Notes
Page generated in 0.005 seconds© 2016 population.us | Terms of use | Contact