Last official estimated population of Nez Perce County was 39,321 (year 2014)[1]. This was 0.012% of total US population and 2.4% of total Idaho state population. Area of Nez Perce County is 856.3 mi² (=2217.8 km²), in this year population density was 45.92 p/mi². If population growth rate would be same as in period 2010-2014 (+0.04%/yr), Nez Perce County population in 2026 would be 39,489 [0].
Historical population of Nez Perce County for period 1870-2014 [1] , [2] , [3]:
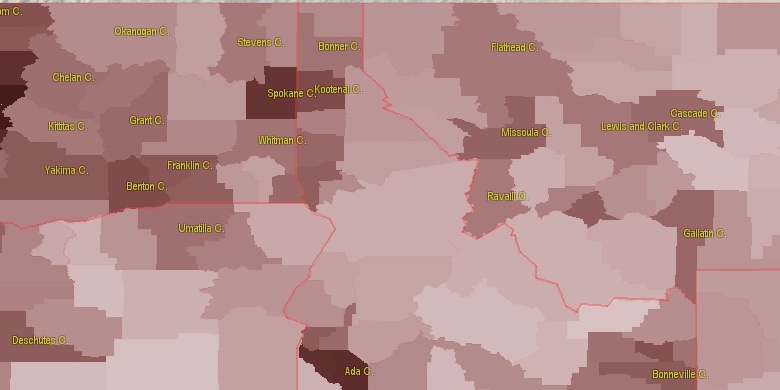
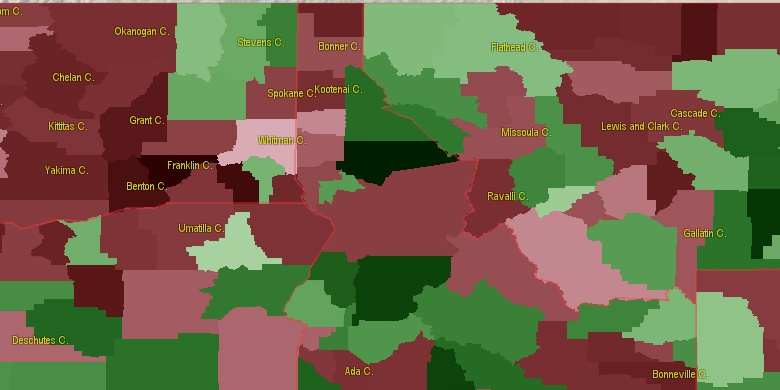
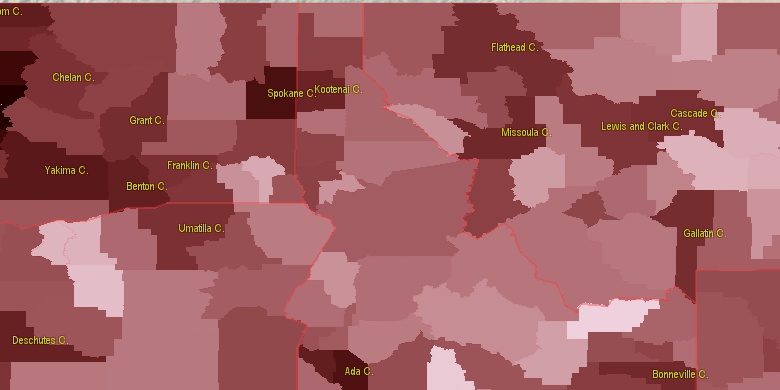
Estimated population for 2014[1]. Population density is in p./sq.mi [4]. Changes are for period 2010-2015. Value is %/year. Boundary lines are approx. 2012 [5]. Click on flag to hide it.
Population • Density • Changes • Legends • Position

[1870-1880] +9.45 %/yr
[1880-1890] -3.26 %/yr
[1890-1900] +17.05 %/yr
[1900-1910] +6.1 %/yr
[1910-1920] -4.77 %/yr
[1920-1930] +1.44 %/yr
[1930-1940] +0.71 %/yr
[1940-1950] +1.84 %/yr
[1950-1960] +1.79 %/yr
[1960-1970] +1.16 %/yr
[1970-1980] +0.9 %/yr
[1980-1990] +0.16 %/yr
[1990-2000] +1.04 %/yr
[2000-2005] +0.35 %/yr
[2005-2010] +0.62 %/yr
[2010-2014] +0.04 %/yr
Looking for settlements in Nez Perce County? Visit this page: Settlements in Nez Perce County, ID
Population of Nez Perce County by age groups male (M) and female (F)[1b]
| Age Gr. | (M) | (F) | Total |
| 0 to 4 | 1313 | 1170 | 2,483 |
| 5 to 9 | 1221 | 1054 | 2,275 |
| 10 to 14 | 1268 | 1152 | 2,420 |
| 15 to 19 | 1241 | 1147 | 2,388 |
| 20 to 24 | 1387 | 1402 | 2,789 |
| 25 to 29 | 1327 | 1344 | 2,671 |
| 30 to 34 | 1172 | 1177 | 2,349 |
| 35 to 39 | 1088 | 1076 | 2,164 |
| 40 to 44 | 1150 | 1100 | 2,250 |
| 45 to 49 | 1132 | 1282 | 2,414 |
| 50 to 54 | 1348 | 1412 | 2,760 |
| 55 to 59 | 1450 | 1433 | 2,883 |
| 60 to 64 | 1253 | 1331 | 2,584 |
| 65 to 69 | 1082 | 1161 | 2,243 |
| 70 to 74 | 825 | 940 | 1,765 |
| 75 to 79 | 626 | 722 | 1,348 |
| 80 to 84 | 447 | 582 | 1,029 |
| 85+ | 465 | 727 | 1,192 |
Nez Perce County resident population estimates by Sex, Race, and Hispanic Origin[1b]. For full list of abbrevations see: population.us/about page.
| Race | Male | Female | Total |
| NH | 19034 | 19503 | 38,537 |
| WAC | 18345 | 18661 | 37,006 |
| WA | 17848 | 18184 | 36,032 |
| NHWAC | 17697 | 18109 | 35,806 |
| NHWA | 17272 | 17686 | 34,958 |
| IAC | 1438 | 1518 | 2,956 |
| NHIAC | 1300 | 1331 | 2,631 |
| IA | 1127 | 1203 | 2,330 |
| NHIA | 1042 | 1056 | 2,098 |
| H | 761 | 709 | 1,470 |
| HWAC | 648 | 552 | 1,200 |
| HWA | 576 | 498 | 1,074 |
| TOM | 521 | 497 | 1,018 |
| NHTOM | 440 | 441 | 881 |
| AAC | 288 | 337 | 625 |
| NHAAC | 266 | 326 | 592 |
| BAC | 212 | 160 | 372 |
| AA | 156 | 215 | 371 |
| NHAA | 153 | 210 | 363 |
| NHBAC | 184 | 147 | 331 |
| HIAC | 138 | 187 | 325 |
| HIA | 85 | 147 | 232 |
| BA | 121 | 94 | 215 |
| NHBA | 108 | 91 | 199 |
| HTOM | 81 | 56 | 137 |
| NAC | 69 | 62 | 131 |
| NHNAC | 59 | 57 | 116 |
| HBAC | 28 | 13 | 41 |
| NA | 22 | 19 | 41 |
| NHNA | 19 | 19 | 38 |
| HAAC | 22 | 11 | 33 |
| HBA | 13 | 3 | 16 |
| HNAC | 10 | 5 | 15 |
| HAA | 3 | 5 | 8 |
| HNA | 3 | 0 | 3 |
• Whitman County population
54 mi,  317°
317°
• Latah County
33.5 mi,  2°
2°
• Asotin County
24.6 mi,  244°
244°
• Idaho County
70.4 mi,  118°
118°
• Benewah County
61.4 mi,  5°
5°
• Clearwater County
57.6 mi,  66°
66°
• Wallowa County
55 mi,  201°
201°
• Columbia County
55 mi,  267°
267°
• Lewis County
17.4 mi,  112°
112°
• Garfield County
37.6 mi,  280°
280°
[0] Calculated by population.us from last known population growth rate, not official data.
[1] County population - 2014, archived from the original, retrieved 02/23/2016
[1b] Annual County Resident Population Estimates by Age, Sex, Race, and Hispanic Origin, (used only data for 2014) archived from the original, retrieved 02/23/2016
[2] County population - 2000-2010, archived from the original, retrieved 02/23/2016
[3] Population of States and Counties of the United States: 1790 to 1992, PDF, 15 Mb, census.gov, retrieved 02/23/2016
[4] County area, latitude longitude data, retrieved 02/23/2016
[5] County boundaries, CSV files on boundaries.us, retrived 03/18/2016
Page generated in 0.008 seconds© 2016 population.us | Terms of use | Contact