Last official estimated population of Atchison County was 16,870 (year 2014)[1]. This was 0.005% of total US population and 0.6% of total Kansas state population. Area of Atchison County is 433.8 mi² (=1123.6 km²), in this year population density was 38.89 p/mi². If population growth rate would be same as in period 2010-2014 (-0.08%/yr), Atchison County population in 2026 would be 16,709 [0].
Historical population of Atchison County for period 1860-2014 [1] , [2] , [3]:
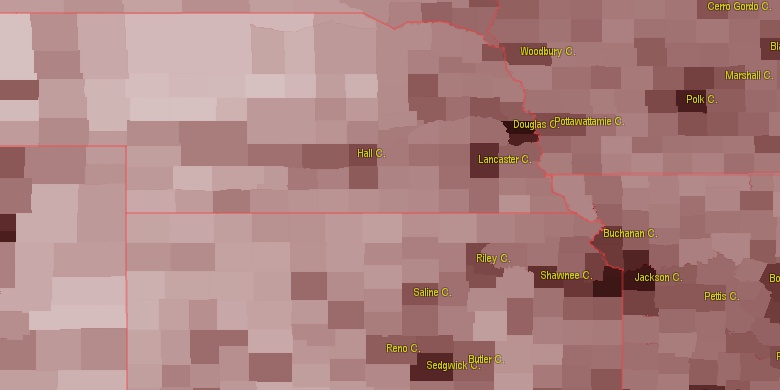
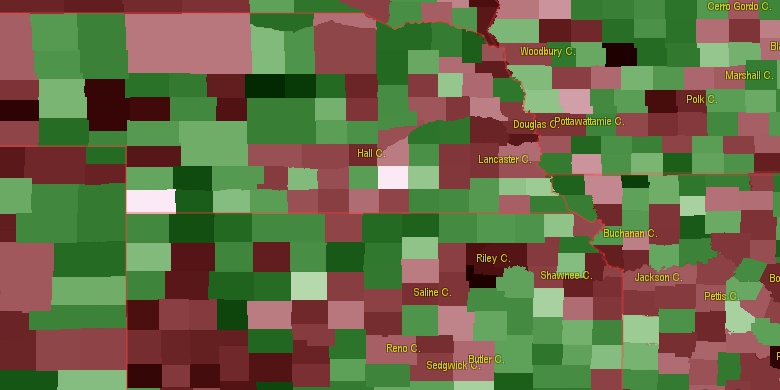
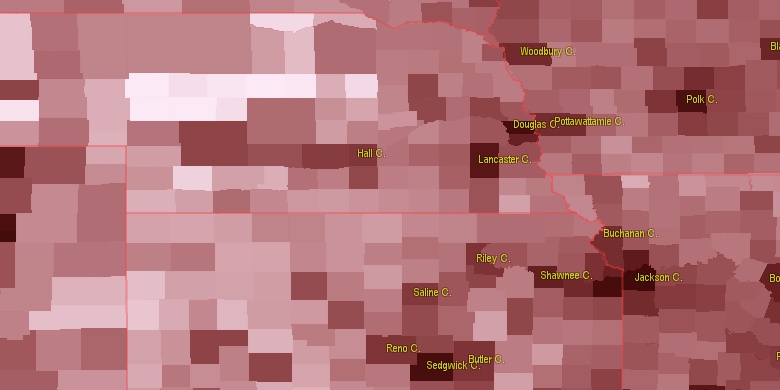
Estimated population for 2014[1]. Population density is in p./sq.mi [4]. Changes are for period 2010-2015. Value is %/year. Boundary lines are approx. 2012 [5]. Click on flag to hide it.
Population • Density • Changes • Legends • Position

[1860-1870] +7.21 %/yr
[1870-1880] +5.57 %/yr
[1880-1890] +0.03 %/yr
[1890-1900] +0.67 %/yr
[1900-1910] -0.18 %/yr
[1910-1920] -1.81 %/yr
[1920-1930] +0.23 %/yr
[1930-1940] -0.74 %/yr
[1940-1950] -0.33 %/yr
[1950-1960] -0.28 %/yr
[1960-1970] -0.86 %/yr
[1970-1980] -0.41 %/yr
[1980-1990] -0.83 %/yr
[1990-2000] -0.09 %/yr
[2000-2005] +0.09 %/yr
[2005-2010] +0.07 %/yr
[2010-2014] -0.08 %/yr
Looking for settlements in Atchison County? Visit this page: Settlements in Atchison County, KS
Population of Atchison County by age groups male (M) and female (F)[1b]
| Age Gr. | (M) | (F) | Total |
| 0 to 4 | 543 | 507 | 1,050 |
| 5 to 9 | 545 | 512 | 1,057 |
| 10 to 14 | 582 | 520 | 1,102 |
| 15 to 19 | 733 | 756 | 1,489 |
| 20 to 24 | 679 | 804 | 1,483 |
| 25 to 29 | 484 | 467 | 951 |
| 30 to 34 | 437 | 440 | 877 |
| 35 to 39 | 426 | 395 | 821 |
| 40 to 44 | 441 | 441 | 882 |
| 45 to 49 | 468 | 490 | 958 |
| 50 to 54 | 554 | 543 | 1,097 |
| 55 to 59 | 564 | 607 | 1,171 |
| 60 to 64 | 442 | 446 | 888 |
| 65 to 69 | 357 | 418 | 775 |
| 70 to 74 | 288 | 337 | 625 |
| 75 to 79 | 199 | 290 | 489 |
| 80 to 84 | 163 | 241 | 404 |
| 85+ | 130 | 264 | 394 |
Atchison County resident population estimates by Sex, Race, and Hispanic Origin[1b]. For full list of abbrevations see: population.us/about page.
| Race | Male | Female | Total |
| NH | 7789 | 8245 | 16,034 |
| WAC | 7479 | 7936 | 15,415 |
| WA | 7259 | 7737 | 14,996 |
| NHWAC | 7251 | 7715 | 14,966 |
| NHWA | 7043 | 7538 | 14,581 |
| BAC | 579 | 531 | 1,110 |
| NHBAC | 556 | 518 | 1,074 |
| BA | 451 | 407 | 858 |
| NHBA | 436 | 402 | 838 |
| H | 246 | 233 | 479 |
| HWAC | 228 | 221 | 449 |
| TOM | 221 | 214 | 435 |
| HWA | 216 | 199 | 415 |
| NHTOM | 209 | 191 | 400 |
| IAC | 131 | 142 | 273 |
| NHIAC | 124 | 122 | 246 |
| AAC | 67 | 87 | 154 |
| NHAAC | 67 | 83 | 150 |
| IA | 56 | 57 | 113 |
| NHIA | 53 | 51 | 104 |
| AA | 44 | 59 | 103 |
| NHAA | 44 | 59 | 103 |
| HBAC | 23 | 13 | 36 |
| HTOM | 12 | 23 | 35 |
| HIAC | 7 | 20 | 27 |
| HBA | 15 | 5 | 20 |
| NAC | 7 | 7 | 14 |
| NHNAC | 7 | 7 | 14 |
| HIA | 3 | 6 | 9 |
| NA | 4 | 4 | 8 |
| NHNA | 4 | 4 | 8 |
| HAAC | 0 | 4 | 4 |
| HNAC | 0 | 0 | 0 |
| HNA | 0 | 0 | 0 |
| HAA | 0 | 0 | 0 |
• Wyandotte County population
41.2 mi,  134°
134°
• Platte County
31.3 mi,  109°
109°
• Buchanan County
28.3 mi,  71°
71°
• Leavenworth County
27.9 mi,  148°
148°
• Jefferson County
20.5 mi,  189°
189°
• Jackson County
27 mi,  251°
251°
• Nemaha County
40.9 mi,  295°
295°
• Brown County
24.4 mi,  326°
326°
• Doniphan County
19.8 mi,  26°
26°
• Holt County
39.2 mi,  7°
7°
[0] Calculated by population.us from last known population growth rate, not official data.
[1] County population - 2014, archived from the original, retrieved 02/23/2016
[1b] Annual County Resident Population Estimates by Age, Sex, Race, and Hispanic Origin, (used only data for 2014) archived from the original, retrieved 02/23/2016
[2] County population - 2000-2010, archived from the original, retrieved 02/23/2016
[3] Population of States and Counties of the United States: 1790 to 1992, PDF, 15 Mb, census.gov, retrieved 02/23/2016
[4] County area, latitude longitude data, retrieved 02/23/2016
[5] County boundaries, CSV files on boundaries.us, retrived 03/18/2016
Page generated in 0.013 seconds© 2016 population.us | Terms of use | Contact