Last official estimated population of Powell County was 12,665 (year 2014)[1]. This was 0.004% of total US population and 0.3% of total Kentucky state population. Area of Powell County is 180.1 mi² (=466.5 km²), in this year population density was 70.31 p/mi². If population growth rate would be same as in period 2010-2014 (+0.1%/yr), Powell County population in 2026 would be 12,822 [0].
Historical population of Powell County for period 1860-2014 [1] , [2] , [3]:
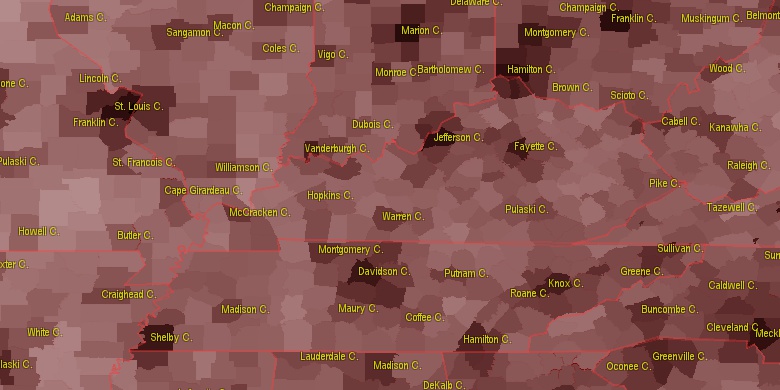
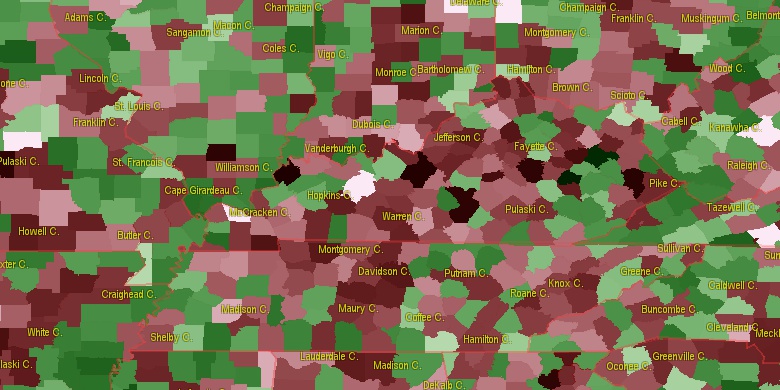
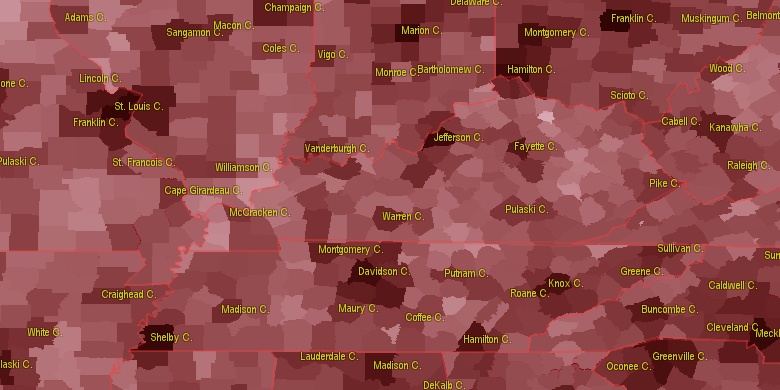
Estimated population for 2014[1]. Population density is in p./sq.mi [4]. Changes are for period 2010-2015. Value is %/year. Boundary lines are approx. 2012 [5]. Click on flag to hide it.
Population • Density • Changes • Legends • Position

[1860-1870] +1.42 %/yr
[1870-1880] +3.42 %/yr
[1880-1890] +2.59 %/yr
[1890-1900] +3.21 %/yr
[1900-1910] -0.27 %/yr
[1910-1920] +0.74 %/yr
[1920-1930] -1.5 %/yr
[1930-1940] +2.84 %/yr
[1940-1950] -1.18 %/yr
[1950-1960] -0.2 %/yr
[1960-1970] +1.45 %/yr
[1970-1980] +3.72 %/yr
[1980-1990] +0.51 %/yr
[1990-2000] +1.25 %/yr
[2000-2005] -0.18 %/yr
[2005-2010] -0.78 %/yr
[2010-2014] +0.1 %/yr
Looking for settlements in Powell County? Visit this page: Settlements in Powell County, KY
Population of Powell County by age groups male (M) and female (F)[1b]
| Age Gr. | (M) | (F) | Total |
| 0 to 4 | 448 | 416 | 864 |
| 5 to 9 | 409 | 386 | 795 |
| 10 to 14 | 403 | 389 | 792 |
| 15 to 19 | 381 | 397 | 778 |
| 20 to 24 | 389 | 385 | 774 |
| 25 to 29 | 369 | 371 | 740 |
| 30 to 34 | 381 | 402 | 783 |
| 35 to 39 | 397 | 394 | 791 |
| 40 to 44 | 440 | 440 | 880 |
| 45 to 49 | 466 | 384 | 850 |
| 50 to 54 | 416 | 470 | 886 |
| 55 to 59 | 457 | 471 | 928 |
| 60 to 64 | 394 | 394 | 788 |
| 65 to 69 | 318 | 332 | 650 |
| 70 to 74 | 204 | 230 | 434 |
| 75 to 79 | 149 | 181 | 330 |
| 80 to 84 | 93 | 126 | 219 |
| 85+ | 56 | 96 | 152 |
Powell County resident population estimates by Sex, Race, and Hispanic Origin[1b]. For full list of abbrevations see: population.us/about page.
| Race | Male | Female | Total |
| WAC | 6092 | 6196 | 12,288 |
| NH | 6076 | 6202 | 12,278 |
| WA | 6038 | 6152 | 12,190 |
| NHWAC | 6003 | 6135 | 12,138 |
| NHWA | 5949 | 6092 | 12,041 |
| H | 94 | 62 | 156 |
| HWAC | 89 | 61 | 150 |
| HWA | 89 | 60 | 149 |
| BAC | 85 | 56 | 141 |
| NHBAC | 81 | 56 | 137 |
| TOM | 57 | 47 | 104 |
| NHTOM | 56 | 46 | 102 |
| BA | 60 | 39 | 99 |
| NHBA | 57 | 39 | 96 |
| IAC | 36 | 30 | 66 |
| NHIAC | 35 | 30 | 65 |
| AAC | 15 | 26 | 41 |
| NHAAC | 14 | 24 | 38 |
| AA | 7 | 13 | 20 |
| NHAA | 7 | 12 | 19 |
| IA | 7 | 10 | 17 |
| NHIA | 6 | 10 | 16 |
| NHNAC | 3 | 4 | 7 |
| NAC | 3 | 4 | 7 |
| HBAC | 4 | 0 | 4 |
| NA | 1 | 3 | 4 |
| NHNA | 1 | 3 | 4 |
| HBA | 3 | 0 | 3 |
| HAAC | 1 | 2 | 3 |
| HTOM | 1 | 1 | 2 |
| HIAC | 1 | 0 | 1 |
| HIA | 1 | 0 | 1 |
| HAA | 0 | 1 | 1 |
| HNAC | 0 | 0 | 0 |
| HNA | 0 | 0 | 0 |
• Madison County population
25.5 mi,  257°
257°
• Clark County
21.2 mi,  303°
303°
• Montgomery County
17.2 mi,  342°
342°
• Estill County
10.9 mi,  226°
226°
• Jackson County
29.6 mi,  201°
201°
• Bath County
24.7 mi,  10°
10°
• Lee County
14.4 mi,  157°
157°
• Wolfe County
18.2 mi,  102°
102°
• Menifee County
16 mi,  49°
49°
• Owsley County
27 mi, 164°
[0] Calculated by population.us from last known population growth rate, not official data.
[1] County population - 2014, archived from the original, retrieved 02/23/2016
[1b] Annual County Resident Population Estimates by Age, Sex, Race, and Hispanic Origin, (used only data for 2014) archived from the original, retrieved 02/23/2016
[2] County population - 2000-2010, archived from the original, retrieved 02/23/2016
[3] Population of States and Counties of the United States: 1790 to 1992, PDF, 15 Mb, census.gov, retrieved 02/23/2016
[4] County area, latitude longitude data, retrieved 02/23/2016
[5] County boundaries, CSV files on boundaries.us, retrived 03/18/2016
See note 53 Kentucky Notes
Page generated in 0.015 seconds© 2016 population.us | Terms of use | Contact