Last official estimated population of Luce County was 6,599 (year 2014)[1]. This was 0.002% of total US population and 0.1% of total Michigan state population. Area of Luce County is 1,912.5 mi² (=4953.3 km²), in this year population density was 3.45 p/mi². If population growth rate would be same as in period 2010-2014 (-0.12%/yr), Luce County population in 2026 would be 6,504 [0].
Historical population of Luce County for period 1890-2014 [1] , [2] , [3]:
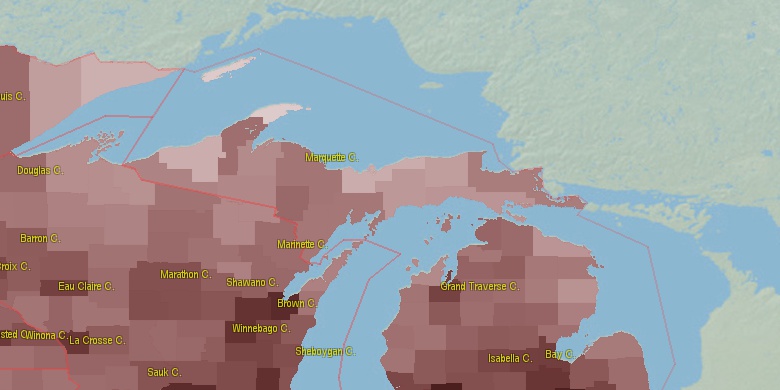
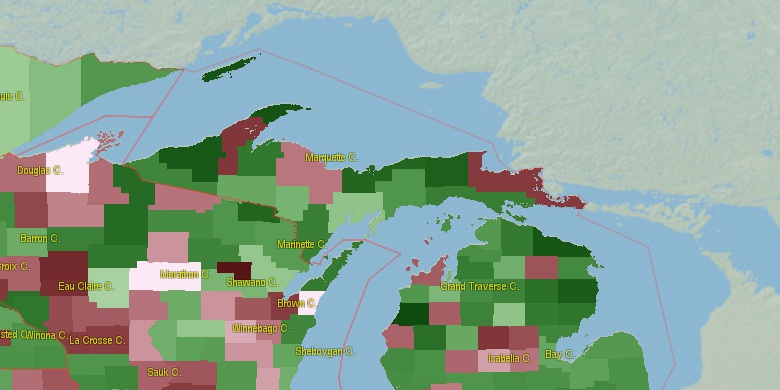
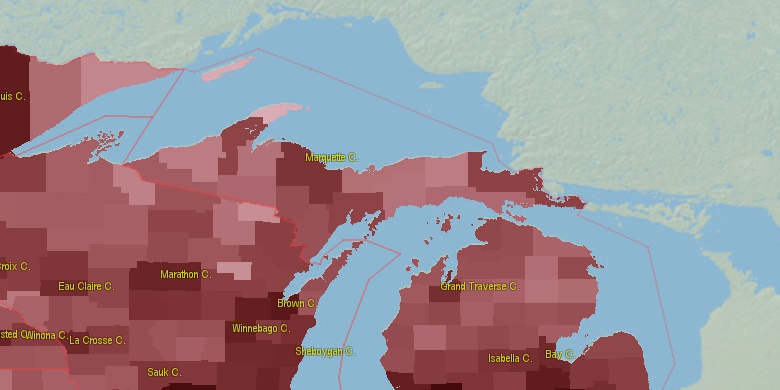
Estimated population for 2014[1]. Population density is in p./sq.mi [4]. Changes are for period 2010-2015. Value is %/year. Boundary lines are approx. 2012 [5]. Click on flag to hide it.
Population • Density • Changes • Legends • Position

[1890-1900] +1.97 %/yr
[1900-1910] +2.99 %/yr
[1910-1920] +4.38 %/yr
[1920-1930] +0.6 %/yr
[1930-1940] +1.29 %/yr
[1940-1950] +0.94 %/yr
[1950-1960] -0.4 %/yr
[1960-1970] -1.41 %/yr
[1970-1980] -0.19 %/yr
[1980-1990] -1.43 %/yr
[1990-2000] +2 %/yr
[2000-2005] -0.63 %/yr
[2005-2010] -0.53 %/yr
[2010-2014] -0.12 %/yr
Looking for settlements in Luce County? Visit this page: Settlements in Luce County, MI
Population of Luce County by age groups male (M) and female (F)[1b]
| Age Gr. | (M) | (F) | Total |
| 0 to 4 | 138 | 130 | 268 |
| 5 to 9 | 148 | 141 | 289 |
| 10 to 14 | 162 | 142 | 304 |
| 15 to 19 | 175 | 144 | 319 |
| 20 to 24 | 277 | 102 | 379 |
| 25 to 29 | 250 | 100 | 350 |
| 30 to 34 | 326 | 139 | 465 |
| 35 to 39 | 301 | 127 | 428 |
| 40 to 44 | 298 | 156 | 454 |
| 45 to 49 | 268 | 156 | 424 |
| 50 to 54 | 291 | 180 | 471 |
| 55 to 59 | 296 | 253 | 549 |
| 60 to 64 | 220 | 214 | 434 |
| 65 to 69 | 214 | 169 | 383 |
| 70 to 74 | 149 | 186 | 335 |
| 75 to 79 | 125 | 137 | 262 |
| 80 to 84 | 65 | 96 | 161 |
| 85+ | 58 | 93 | 151 |
Luce County resident population estimates by Sex, Race, and Hispanic Origin[1b]. For full list of abbrevations see: population.us/about page.
| Race | Male | Female | Total |
| NH | 3710 | 2628 | 6,338 |
| WAC | 2847 | 2492 | 5,339 |
| NHWAC | 2805 | 2463 | 5,268 |
| WA | 2733 | 2402 | 5,135 |
| NHWA | 2698 | 2374 | 5,072 |
| BAC | 764 | 29 | 793 |
| NHBAC | 759 | 27 | 786 |
| BA | 736 | 6 | 742 |
| NHBA | 734 | 6 | 740 |
| IAC | 247 | 220 | 467 |
| NHIAC | 235 | 214 | 449 |
| IA | 166 | 156 | 322 |
| NHIA | 159 | 151 | 310 |
| TOM | 116 | 92 | 208 |
| NHTOM | 109 | 90 | 199 |
| H | 51 | 37 | 88 |
| HWAC | 42 | 29 | 71 |
| HWA | 35 | 28 | 63 |
| AAC | 22 | 10 | 32 |
| NHAAC | 21 | 10 | 31 |
| HIAC | 12 | 6 | 18 |
| NHAA | 10 | 6 | 16 |
| AA | 10 | 6 | 16 |
| HIA | 7 | 5 | 12 |
| HTOM | 7 | 2 | 9 |
| NAC | 2 | 6 | 8 |
| HBAC | 5 | 2 | 7 |
| NHNAC | 2 | 4 | 6 |
| NA | 0 | 3 | 3 |
| HBA | 2 | 0 | 2 |
| HNAC | 0 | 2 | 2 |
| HNA | 0 | 2 | 2 |
| HAAC | 1 | 0 | 1 |
| NHNA | 0 | 1 | 1 |
| HAA | 0 | 0 | 0 |
• Marquette County population
96.7 mi,  258°
258°
• Chippewa County
66.1 mi,  130°
130°
• Delta County
100.5 mi,  218°
218°
• Emmet County
97.5 mi,  163°
163°
• Cheboygan County
113.7 mi,  152°
152°
• Charlevoix County
98.8 mi,  176°
176°
• Leelanau County
126 mi,  190°
190°
• Mackinac County
55 mi,  166°
166°
• Alger County
47.2 mi,  281°
281°
• Schoolcraft County
69.9 mi,  204°
204°
[0] Calculated by population.us from last known population growth rate, not official data.
[1] County population - 2014, archived from the original, retrieved 02/23/2016
[1b] Annual County Resident Population Estimates by Age, Sex, Race, and Hispanic Origin, (used only data for 2014) archived from the original, retrieved 02/23/2016
[2] County population - 2000-2010, archived from the original, retrieved 02/23/2016
[3] Population of States and Counties of the United States: 1790 to 1992, PDF, 15 Mb, census.gov, retrieved 02/23/2016
[4] County area, latitude longitude data, retrieved 02/23/2016
[5] County boundaries, CSV files on boundaries.us, retrived 03/18/2016
*Chippewa, Mackinac Michigan Notes
Page generated in 0.018 seconds© 2016 population.us | Terms of use | Contact