Last official estimated population of Ogemaw County was 21,642 (year 2014)[1]. This was 0.007% of total US population and 0.2% of total Michigan state population. Area of Ogemaw County is 575.0 mi² (=1489.1 km²), in this year population density was 37.64 p/mi². If population growth rate would be same as in period 2010-2014 (-0.07%/yr), Ogemaw County population in 2026 would be 21,472 [0].
Historical population of Ogemaw County for period 1870-2014 [1] , [2] , [3]:
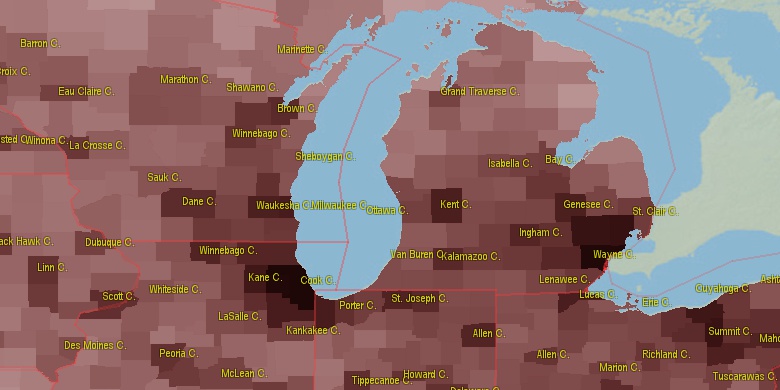
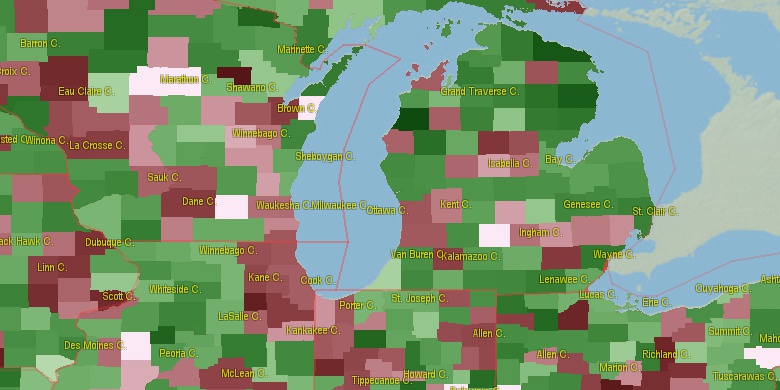
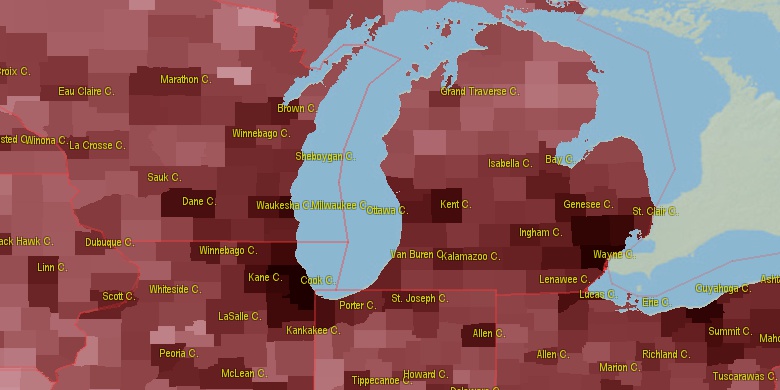
Estimated population for 2014[1]. Population density is in p./sq.mi [4]. Changes are for period 2010-2015. Value is %/year. Boundary lines are approx. 2012 [5]. Click on flag to hide it.
Population • Density • Changes • Legends • Position

[1870-1880] +66.06 %/yr
[1880-1890] +11.3 %/yr
[1890-1900] +3.35 %/yr
[1900-1910] +1.38 %/yr
[1910-1920] -1.34 %/yr
[1920-1930] -1.65 %/yr
[1930-1940] +2.83 %/yr
[1940-1950] +0.69 %/yr
[1950-1960] +0.35 %/yr
[1960-1970] +2.09 %/yr
[1970-1980] +3.28 %/yr
[1980-1990] +1.29 %/yr
[1990-2000] +1.48 %/yr
[2000-2005] +0.39 %/yr
[2005-2010] -0.34 %/yr
[2010-2014] -0.07 %/yr
Looking for settlements in Ogemaw County? Visit this page: Settlements in Ogemaw County, MI
Population of Ogemaw County by age groups male (M) and female (F)[1b]
| Age Gr. | (M) | (F) | Total |
| 0 to 4 | 529 | 452 | 981 |
| 5 to 9 | 526 | 516 | 1,042 |
| 10 to 14 | 572 | 574 | 1,146 |
| 15 to 19 | 618 | 585 | 1,203 |
| 20 to 24 | 543 | 532 | 1,075 |
| 25 to 29 | 457 | 456 | 913 |
| 30 to 34 | 519 | 489 | 1,008 |
| 35 to 39 | 479 | 516 | 995 |
| 40 to 44 | 536 | 540 | 1,076 |
| 45 to 49 | 552 | 584 | 1,136 |
| 50 to 54 | 798 | 847 | 1,645 |
| 55 to 59 | 957 | 947 | 1,904 |
| 60 to 64 | 888 | 908 | 1,796 |
| 65 to 69 | 795 | 820 | 1,615 |
| 70 to 74 | 710 | 693 | 1,403 |
| 75 to 79 | 501 | 489 | 990 |
| 80 to 84 | 272 | 283 | 555 |
| 85+ | 193 | 363 | 556 |
Ogemaw County resident population estimates by Sex, Race, and Hispanic Origin[1b]. For full list of abbrevations see: population.us/about page.
| Race | Male | Female | Total |
| WAC | 10270 | 10399 | 20,669 |
| NH | 10225 | 10399 | 20,624 |
| WA | 10121 | 10253 | 20,374 |
| NHWAC | 10068 | 10227 | 20,295 |
| NHWA | 9933 | 10098 | 20,031 |
| H | 220 | 195 | 415 |
| IAC | 184 | 192 | 376 |
| HWAC | 202 | 172 | 374 |
| HWA | 188 | 155 | 343 |
| NHIAC | 165 | 172 | 337 |
| TOM | 158 | 148 | 306 |
| NHTOM | 141 | 129 | 270 |
| IA | 87 | 101 | 188 |
| BAC | 92 | 80 | 172 |
| NHIA | 76 | 91 | 167 |
| NHBAC | 83 | 58 | 141 |
| AAC | 48 | 73 | 121 |
| NHAAC | 43 | 71 | 114 |
| AA | 31 | 52 | 83 |
| NHAA | 30 | 52 | 82 |
| BA | 42 | 39 | 81 |
| NHBA | 40 | 28 | 68 |
| HIAC | 19 | 20 | 39 |
| HTOM | 17 | 19 | 36 |
| HBAC | 9 | 22 | 31 |
| HIA | 11 | 10 | 21 |
| NAC | 13 | 3 | 16 |
| NHNAC | 10 | 3 | 13 |
| HBA | 2 | 11 | 13 |
| NA | 6 | 1 | 7 |
| HAAC | 5 | 2 | 7 |
| NHNA | 5 | 1 | 6 |
| HNAC | 3 | 0 | 3 |
| HNA | 1 | 0 | 1 |
| HAA | 1 | 0 | 1 |
• Bay County population
44.4 mi,  170°
170°
• Midland County
49 mi,  194°
194°
• Clare County
42.4 mi,  236°
236°
• Gladwin County
27 mi,  208°
208°
• Roscommon County
23.9 mi,  271°
271°
• Arenac County
28.1 mi,  136°
136°
• Missaukee County
47.3 mi, 269°
• Crawford County
33.8 mi,  315°
315°
• Montmorency County
47.7 mi,  359°
359°
• Oscoda County
24.5 mi,  0°
0°
[0] Calculated by population.us from last known population growth rate, not official data.
[1] County population - 2014, archived from the original, retrieved 02/23/2016
[1b] Annual County Resident Population Estimates by Age, Sex, Race, and Hispanic Origin, (used only data for 2014) archived from the original, retrieved 02/23/2016
[2] County population - 2000-2010, archived from the original, retrieved 02/23/2016
[3] Population of States and Counties of the United States: 1790 to 1992, PDF, 15 Mb, census.gov, retrieved 02/23/2016
[4] County area, latitude longitude data, retrieved 02/23/2016
[5] County boundaries, CSV files on boundaries.us, retrived 03/18/2016
Page generated in 0.012 seconds© 2016 population.us | Terms of use | Contact