Last official estimated population of Richland County was 16,317 (year 2014)[1]. This was 0.005% of total US population and 2.2% of total North Dakota state population. Area of Richland County is 1,445.4 mi² (=3743.7 km²), in this year population density was 11.29 p/mi². If population growth rate would be same as in period 2010-2014 (-0.01%/yr), Richland County population in 2026 would be 16,305 [0].
Historical population of Richland County for period 1880-2014 [1] , [2] , [3]:
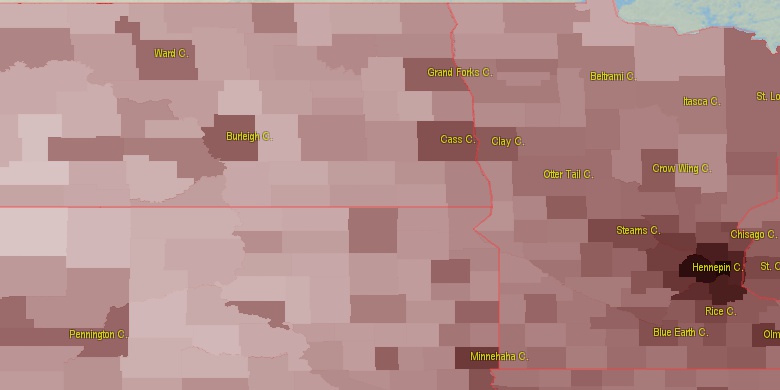
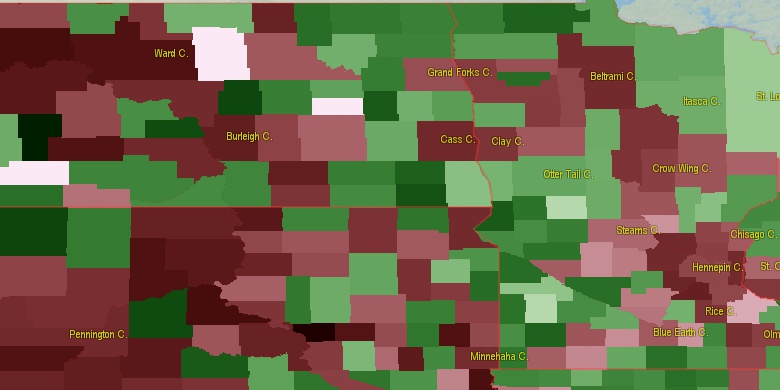
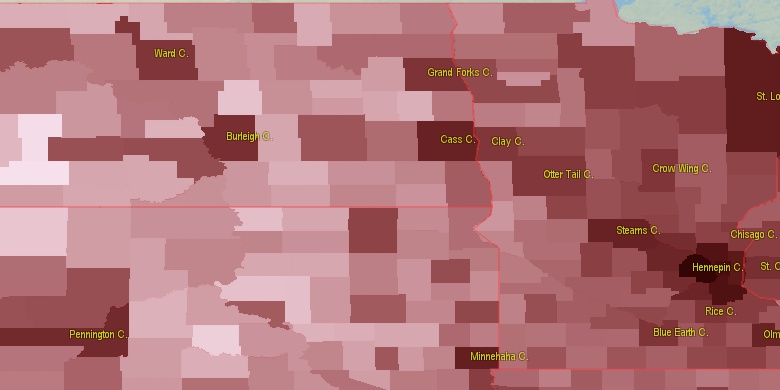
Estimated population for 2014[1]. Population density is in p./sq.mi [4]. Changes are for period 2010-2015. Value is %/year. Boundary lines are approx. 2012 [5]. Click on flag to hide it.
Population • Density • Changes • Legends • Position

[1880-1890] +11.57 %/yr
[1890-1900] +4.92 %/yr
[1900-1910] +1.24 %/yr
[1910-1920] +0.61 %/yr
[1920-1930] +0.06 %/yr
[1930-1940] -0.24 %/yr
[1940-1950] -0.32 %/yr
[1950-1960] -0.54 %/yr
[1960-1970] -0.4 %/yr
[1970-1980] +0.6 %/yr
[1980-1990] -0.57 %/yr
[1990-2000] -0.09 %/yr
[2000-2005] -0.77 %/yr
[2005-2010] -1.17 %/yr
[2010-2014] -0.01 %/yr
Looking for settlements in Richland County? Visit this page: Settlements in Richland County, ND
Population of Richland County by age groups male (M) and female (F)[1b]
| Age Gr. | (M) | (F) | Total |
| 0 to 4 | 432 | 453 | 885 |
| 5 to 9 | 516 | 496 | 1,012 |
| 10 to 14 | 524 | 469 | 993 |
| 15 to 19 | 791 | 672 | 1,463 |
| 20 to 24 | 950 | 692 | 1,642 |
| 25 to 29 | 458 | 401 | 859 |
| 30 to 34 | 435 | 445 | 880 |
| 35 to 39 | 430 | 386 | 816 |
| 40 to 44 | 419 | 383 | 802 |
| 45 to 49 | 446 | 453 | 899 |
| 50 to 54 | 626 | 578 | 1,204 |
| 55 to 59 | 679 | 644 | 1,323 |
| 60 to 64 | 573 | 479 | 1,052 |
| 65 to 69 | 378 | 344 | 722 |
| 70 to 74 | 262 | 281 | 543 |
| 75 to 79 | 207 | 236 | 443 |
| 80 to 84 | 154 | 209 | 363 |
| 85+ | 191 | 340 | 531 |
Richland County resident population estimates by Sex, Race, and Hispanic Origin[1b]. For full list of abbrevations see: population.us/about page.
| Race | Male | Female | Total |
| NH | 8244 | 7739 | 15,983 |
| WAC | 8114 | 7591 | 15,705 |
| WA | 7999 | 7449 | 15,448 |
| NHWAC | 7919 | 7426 | 15,345 |
| NHWA | 7818 | 7302 | 15,120 |
| IAC | 257 | 348 | 605 |
| NHIAC | 221 | 286 | 507 |
| IA | 189 | 261 | 450 |
| H | 227 | 222 | 449 |
| NHIA | 165 | 209 | 374 |
| HWAC | 195 | 165 | 360 |
| HWA | 181 | 147 | 328 |
| TOM | 122 | 148 | 270 |
| NHTOM | 105 | 129 | 234 |
| BAC | 134 | 78 | 212 |
| NHBAC | 122 | 69 | 191 |
| AAC | 79 | 94 | 173 |
| NHAAC | 78 | 89 | 167 |
| BA | 95 | 40 | 135 |
| NHBA | 91 | 39 | 130 |
| AA | 59 | 59 | 118 |
| NHAA | 59 | 57 | 116 |
| HIAC | 36 | 62 | 98 |
| HIA | 24 | 52 | 76 |
| HTOM | 17 | 19 | 36 |
| NAC | 12 | 11 | 23 |
| HBAC | 12 | 9 | 21 |
| NHNAC | 10 | 10 | 20 |
| NA | 7 | 4 | 11 |
| NHNA | 6 | 3 | 9 |
| HAAC | 1 | 5 | 6 |
| HBA | 4 | 1 | 5 |
| HNAC | 2 | 1 | 3 |
| HNA | 1 | 1 | 2 |
| HAA | 0 | 2 | 2 |
• Cass County population
48.1 mi,  341°
341°
• Clay County
48.5 mi,  25°
25°
• Otter Tail County
59.2 mi,  80°
80°
• Roberts County
44.3 mi,  180°
180°
• Wilkin County
23 mi,  73°
73°
• Grant County
50.1 mi,  117°
117°
• Ransom County
36.1 mi,  290°
290°
• Marshall County
47.8 mi,  220°
220°
• Sargent County
34.8 mi,  251°
251°
• Traverse County
40.8 mi,  147°
147°
[0] Calculated by population.us from last known population growth rate, not official data.
[1] County population - 2014, archived from the original, retrieved 02/23/2016
[1b] Annual County Resident Population Estimates by Age, Sex, Race, and Hispanic Origin, (used only data for 2014) archived from the original, retrieved 02/23/2016
[2] County population - 2000-2010, archived from the original, retrieved 02/23/2016
[3] Population of States and Counties of the United States: 1790 to 1992, PDF, 15 Mb, census.gov, retrieved 02/23/2016
[4] County area, latitude longitude data, retrieved 02/23/2016
[5] County boundaries, CSV files on boundaries.us, retrived 03/18/2016
Page generated in 0.015 seconds© 2016 population.us | Terms of use | Contact