Last official estimated population of Decatur County was 11,721 (year 2014)[1]. This was 0.004% of total US population and 0.2% of total Tennessee state population. Area of Decatur County is 344.9 mi² (=893.2 km²), in this year population density was 33.99 p/mi². If population growth rate would be same as in period 2010-2014 (-0.08%/yr), Decatur County population in 2026 would be 11,614 [0].
Historical population of Decatur County for period 1850-2014 [1] , [2] , [3]:
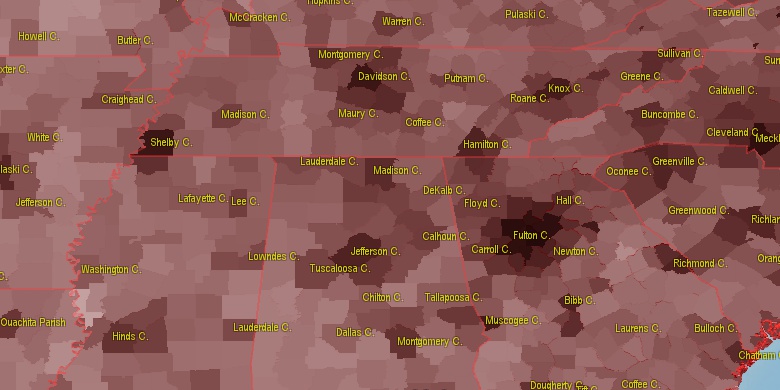
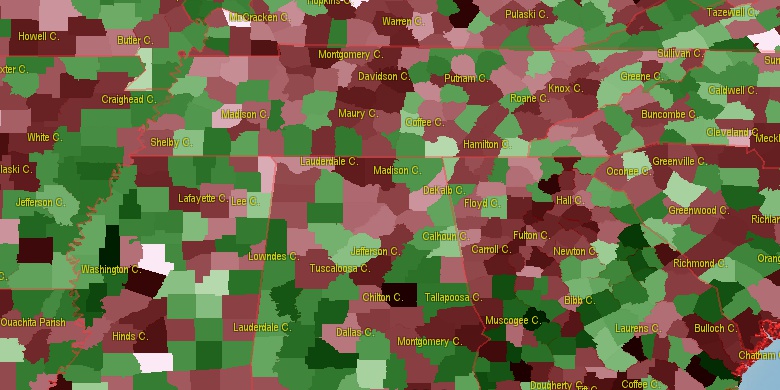
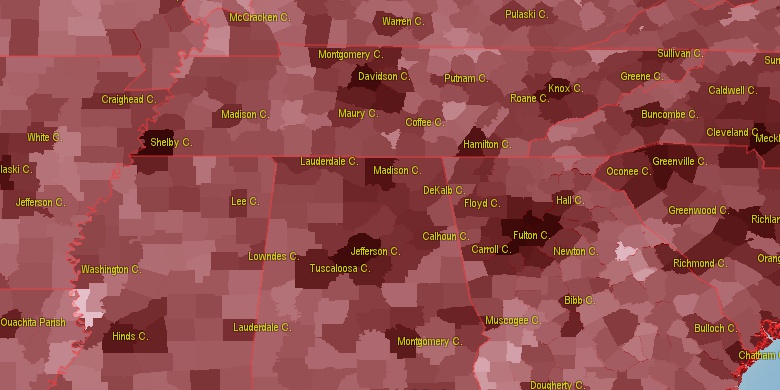
Estimated population for 2014[1]. Population density is in p./sq.mi [4]. Changes are for period 2010-2015. Value is %/year. Boundary lines are approx. 2012 [5]. Click on flag to hide it.
Population • Density • Changes • Legends • Position

[1850-1860] +0.45 %/yr
[1860-1870] +2.16 %/yr
[1870-1880] +0.9 %/yr
[1880-1890] +0.57 %/yr
[1890-1900] +1.5 %/yr
[1900-1910] -0.34 %/yr
[1910-1920] +0.1 %/yr
[1920-1930] -0.09 %/yr
[1930-1940] +0.15 %/yr
[1940-1950] -0.83 %/yr
[1950-1960] -1.25 %/yr
[1960-1970] +1.28 %/yr
[1970-1980] +1.39 %/yr
[1980-1990] -0.36 %/yr
[1990-2000] +1.12 %/yr
[2000-2005] -0.2 %/yr
[2005-2010] +0.27 %/yr
[2010-2014] -0.08 %/yr
Looking for settlements in Decatur County? Visit this page: Settlements in Decatur County, TN
Population of Decatur County by age groups male (M) and female (F)[1b]
| Age Gr. | (M) | (F) | Total |
| 0 to 4 | 291 | 275 | 566 |
| 5 to 9 | 321 | 315 | 636 |
| 10 to 14 | 401 | 343 | 744 |
| 15 to 19 | 304 | 312 | 616 |
| 20 to 24 | 326 | 286 | 612 |
| 25 to 29 | 297 | 286 | 583 |
| 30 to 34 | 304 | 303 | 607 |
| 35 to 39 | 328 | 303 | 631 |
| 40 to 44 | 353 | 337 | 690 |
| 45 to 49 | 364 | 356 | 720 |
| 50 to 54 | 431 | 423 | 854 |
| 55 to 59 | 442 | 464 | 906 |
| 60 to 64 | 416 | 432 | 848 |
| 65 to 69 | 379 | 431 | 810 |
| 70 to 74 | 320 | 389 | 709 |
| 75 to 79 | 223 | 234 | 457 |
| 80 to 84 | 132 | 201 | 333 |
| 85+ | 93 | 251 | 344 |
Decatur County resident population estimates by Sex, Race, and Hispanic Origin[1b]. For full list of abbrevations see: population.us/about page.
| Race | Male | Female | Total |
| NH | 5519 | 5809 | 11,328 |
| WAC | 5473 | 5711 | 11,184 |
| WA | 5397 | 5660 | 11,057 |
| NHWAC | 5289 | 5585 | 10,874 |
| NHWA | 5215 | 5535 | 10,750 |
| BAC | 210 | 206 | 416 |
| NHBAC | 200 | 201 | 401 |
| BA | 176 | 179 | 355 |
| NHBA | 167 | 175 | 342 |
| H | 206 | 132 | 338 |
| HWAC | 184 | 126 | 310 |
| HWA | 182 | 125 | 307 |
| TOM | 81 | 52 | 133 |
| NHTOM | 79 | 51 | 130 |
| AAC | 59 | 42 | 101 |
| NHAAC | 57 | 41 | 98 |
| IAC | 56 | 32 | 88 |
| NHIAC | 50 | 31 | 81 |
| AA | 41 | 33 | 74 |
| NHAA | 39 | 32 | 71 |
| IA | 20 | 15 | 35 |
| NHIA | 15 | 14 | 29 |
| HBAC | 10 | 5 | 15 |
| NAC | 11 | 2 | 13 |
| HBA | 9 | 4 | 13 |
| NA | 10 | 2 | 12 |
| HIAC | 6 | 1 | 7 |
| NHNAC | 5 | 2 | 7 |
| HNAC | 6 | 0 | 6 |
| HNA | 6 | 0 | 6 |
| HIA | 5 | 1 | 6 |
| NHNA | 4 | 2 | 6 |
| HTOM | 2 | 1 | 3 |
| HAAC | 2 | 1 | 3 |
| HAA | 2 | 1 | 3 |
• Carroll County population
31.6 mi,  322°
322°
• Henderson County
16 mi,  282°
282°
• Hardin County
28 mi,  188°
188°
• Hickman County
38.6 mi,  69°
69°
• Humphreys County
35.1 mi,  30°
30°
• Chester County
30.9 mi,  245°
245°
• Wayne County
29.8 mi,  146°
146°
• Benton County
32.3 mi,  3°
3°
• Lewis County
34.9 mi,  99°
99°
• Perry County
14.2 mi, 72°
[0] Calculated by population.us from last known population growth rate, not official data.
[1] County population - 2014, archived from the original, retrieved 02/23/2016
[1b] Annual County Resident Population Estimates by Age, Sex, Race, and Hispanic Origin, (used only data for 2014) archived from the original, retrieved 02/23/2016
[2] County population - 2000-2010, archived from the original, retrieved 02/23/2016
[3] Population of States and Counties of the United States: 1790 to 1992, PDF, 15 Mb, census.gov, retrieved 02/23/2016
[4] County area, latitude longitude data, retrieved 02/23/2016
[5] County boundaries, CSV files on boundaries.us, retrived 03/18/2016
See note 12 Tennessee Notes
Page generated in 0.018 seconds© 2016 population.us | Terms of use | Contact