Last official estimated population of Fentress County was 17,915 (year 2014)[1]. This was 0.006% of total US population and 0.3% of total Tennessee state population. Area of Fentress County is 498.9 mi² (=1292.3 km²), in this year population density was 35.91 p/mi². If population growth rate would be same as in period 2010-2014 (-0.06%/yr), Fentress County population in 2026 would be 17,784 [0].
Historical population of Fentress County for period 1830-2014 [1] , [2] , [3]:
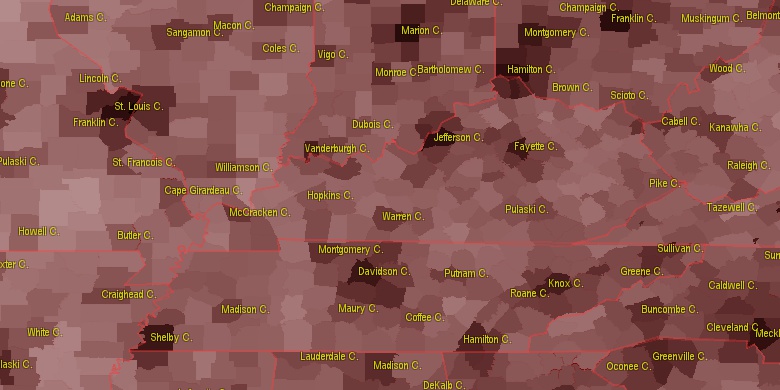
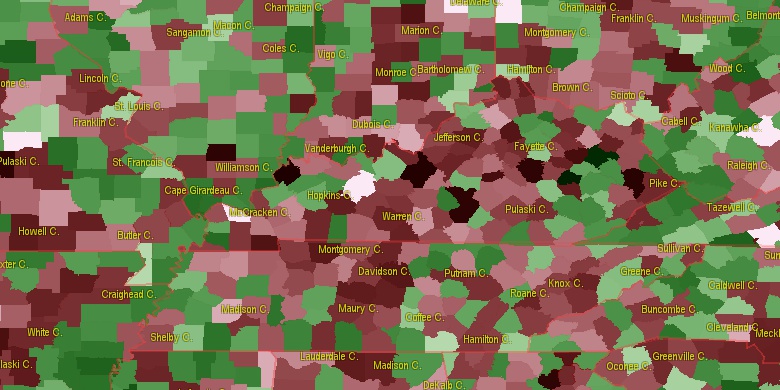
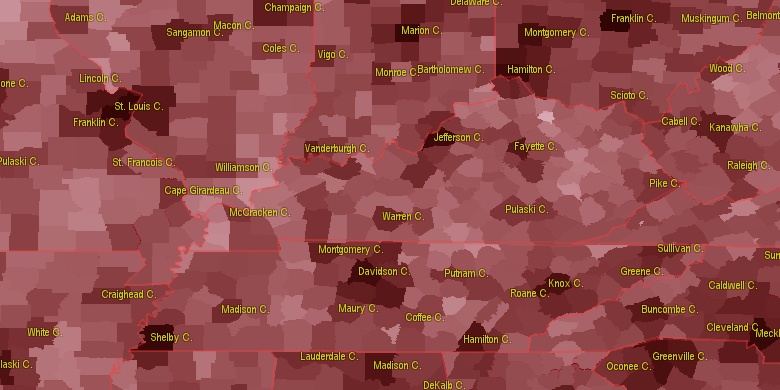
Estimated population for 2014[1]. Population density is in p./sq.mi [4]. Changes are for period 2010-2015. Value is %/year. Boundary lines are approx. 2012 [5]. Click on flag to hide it.
Population • Density • Changes • Legends • Position

[1830-1840] +2.59 %/yr
[1840-1850] +2.29 %/yr
[1850-1860] +1.27 %/yr
[1860-1870] -0.69 %/yr
[1870-1880] +2.33 %/yr
[1880-1890] -1.27 %/yr
[1890-1900] +1.57 %/yr
[1900-1910] +2 %/yr
[1910-1920] +3.43 %/yr
[1920-1930] +0.56 %/yr
[1930-1940] +2.6 %/yr
[1940-1950] +0.45 %/yr
[1950-1960] -1.15 %/yr
[1960-1970] -0.54 %/yr
[1970-1980] +1.65 %/yr
[1980-1990] -0.11 %/yr
[1990-2000] +1.25 %/yr
[2000-2005] +0.66 %/yr
[2005-2010] +0.91 %/yr
[2010-2014] -0.06 %/yr
Looking for settlements in Fentress County? Visit this page: Settlements in Fentress County, TN
Population of Fentress County by age groups male (M) and female (F)[1b]
| Age Gr. | (M) | (F) | Total |
| 0 to 4 | 434 | 450 | 884 |
| 5 to 9 | 521 | 516 | 1,037 |
| 10 to 14 | 622 | 565 | 1,187 |
| 15 to 19 | 650 | 542 | 1,192 |
| 20 to 24 | 467 | 468 | 935 |
| 25 to 29 | 434 | 438 | 872 |
| 30 to 34 | 435 | 445 | 880 |
| 35 to 39 | 448 | 485 | 933 |
| 40 to 44 | 575 | 607 | 1,182 |
| 45 to 49 | 610 | 624 | 1,234 |
| 50 to 54 | 630 | 670 | 1,300 |
| 55 to 59 | 642 | 676 | 1,318 |
| 60 to 64 | 627 | 700 | 1,327 |
| 65 to 69 | 600 | 691 | 1,291 |
| 70 to 74 | 496 | 482 | 978 |
| 75 to 79 | 290 | 343 | 633 |
| 80 to 84 | 165 | 205 | 370 |
| 85+ | 97 | 205 | 302 |
Fentress County resident population estimates by Sex, Race, and Hispanic Origin[1b]. For full list of abbrevations see: population.us/about page.
| Race | Male | Female | Total |
| WAC | 8644 | 9010 | 17,654 |
| NH | 8628 | 8994 | 17,622 |
| WA | 8575 | 8926 | 17,501 |
| NHWAC | 8542 | 8903 | 17,445 |
| NHWA | 8479 | 8825 | 17,304 |
| H | 115 | 118 | 233 |
| HWAC | 102 | 107 | 209 |
| HWA | 96 | 101 | 197 |
| TOM | 73 | 91 | 164 |
| IAC | 72 | 90 | 162 |
| NHTOM | 67 | 85 | 152 |
| NHIAC | 65 | 83 | 148 |
| BAC | 60 | 69 | 129 |
| NHBAC | 51 | 63 | 114 |
| AAC | 39 | 36 | 75 |
| BA | 38 | 37 | 75 |
| NHAAC | 36 | 30 | 66 |
| IA | 31 | 30 | 61 |
| NHBA | 30 | 31 | 61 |
| NHIA | 28 | 29 | 57 |
| AA | 24 | 26 | 50 |
| NHAA | 22 | 22 | 44 |
| HBAC | 9 | 6 | 15 |
| HBA | 8 | 6 | 14 |
| HIAC | 7 | 7 | 14 |
| HTOM | 6 | 6 | 12 |
| HAAC | 3 | 6 | 9 |
| NAC | 3 | 3 | 6 |
| HAA | 2 | 4 | 6 |
| NHNAC | 3 | 2 | 5 |
| HIA | 3 | 1 | 4 |
| NA | 2 | 2 | 4 |
| NHNA | 2 | 2 | 4 |
| HNAC | 0 | 1 | 1 |
| HNA | 0 | 0 | 0 |
• Putnam County population
34.9 mi,  243°
243°
• Cumberland County
29 mi,  186°
186°
• Scott County
24.5 mi,  79°
79°
• Overton County
19.3 mi,  264°
264°
• Morgan County
23.1 mi,  133°
133°
• Wayne County
30.4 mi,  11°
11°
• McCreary County
35.2 mi,  44°
44°
• Clinton County
27.5 mi,  334°
334°
• Clay County
35.9 mi,  289°
289°
• Pickett County
15.2 mi, 329°
[0] Calculated by population.us from last known population growth rate, not official data.
[1] County population - 2014, archived from the original, retrieved 02/23/2016
[1b] Annual County Resident Population Estimates by Age, Sex, Race, and Hispanic Origin, (used only data for 2014) archived from the original, retrieved 02/23/2016
[2] County population - 2000-2010, archived from the original, retrieved 02/23/2016
[3] Population of States and Counties of the United States: 1790 to 1992, PDF, 15 Mb, census.gov, retrieved 02/23/2016
[4] County area, latitude longitude data, retrieved 02/23/2016
[5] County boundaries, CSV files on boundaries.us, retrived 03/18/2016
See note 15 Tennessee Notes
Page generated in 0.016 seconds© 2016 population.us | Terms of use | Contact