Last official estimated population of Hamblen County was 62,607 (year 2014)[1]. This was 0.02% of total US population and 0.9% of total Tennessee state population. Area of Hamblen County is 175.8 mi² (=455.3 km²), in this year population density was 356.12 p/mi². If population growth rate would be same as in period 2010-2014 (+0.03%/yr), Hamblen County population in 2026 would be 62,796 [0].
Historical population of Hamblen County for period 1880-2014 [1] , [2] , [3]:
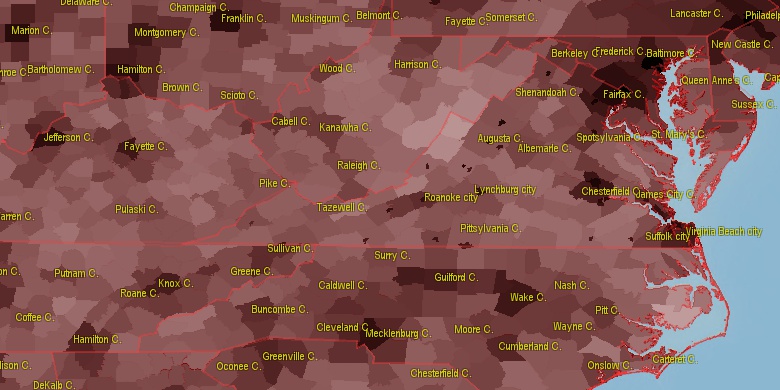
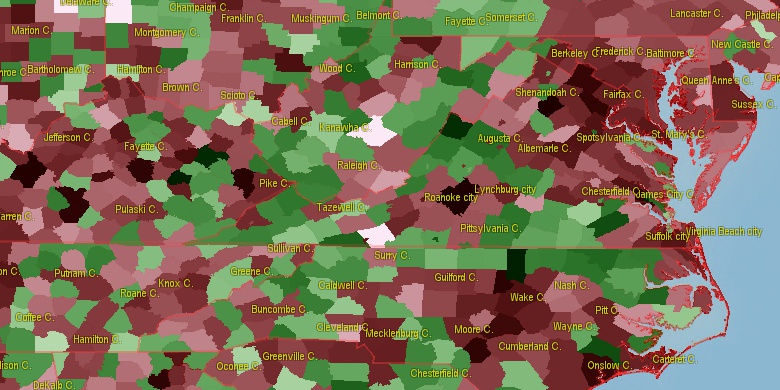
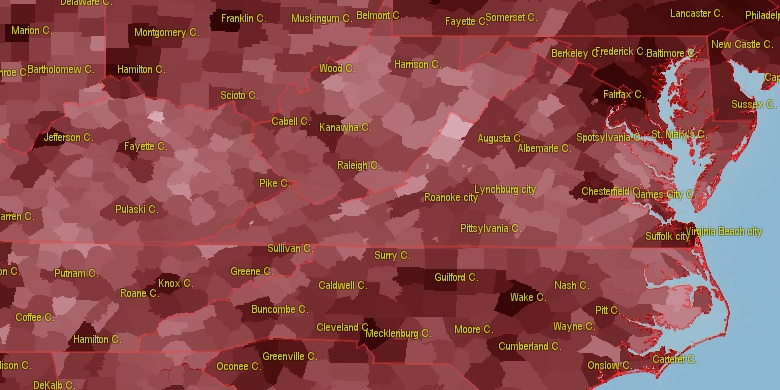
Estimated population for 2014[1]. Population density is in p./sq.mi [4]. Changes are for period 2010-2015. Value is %/year. Boundary lines are approx. 2012 [5]. Click on flag to hide it.
Population • Density • Changes • Legends • Position

[1880-1890] +1.15 %/yr
[1890-1900] +1.09 %/yr
[1900-1910] +0.7 %/yr
[1910-1920] +0.99 %/yr
[1920-1930] +0.99 %/yr
[1930-1940] +1.14 %/yr
[1940-1950] +2.57 %/yr
[1950-1960] +3.27 %/yr
[1960-1970] +1.58 %/yr
[1970-1980] +2.45 %/yr
[1980-1990] +0.24 %/yr
[1990-2000] +1.42 %/yr
[2000-2005] +0.61 %/yr
[2005-2010] +0.86 %/yr
[2010-2014] +0.03 %/yr
Looking for settlements in Hamblen County? Visit this page: Settlements in Hamblen County, TN
Population of Hamblen County by age groups male (M) and female (F)[1b]
| Age Gr. | (M) | (F) | Total |
| 0 to 4 | 1983 | 1932 | 3,915 |
| 5 to 9 | 2042 | 2082 | 4,124 |
| 10 to 14 | 2101 | 2132 | 4,233 |
| 15 to 19 | 1996 | 1791 | 3,787 |
| 20 to 24 | 1977 | 1824 | 3,801 |
| 25 to 29 | 1817 | 1739 | 3,556 |
| 30 to 34 | 1794 | 1825 | 3,619 |
| 35 to 39 | 1866 | 1941 | 3,807 |
| 40 to 44 | 2172 | 2203 | 4,375 |
| 45 to 49 | 2152 | 2129 | 4,281 |
| 50 to 54 | 2251 | 2340 | 4,591 |
| 55 to 59 | 2010 | 2118 | 4,128 |
| 60 to 64 | 1725 | 1984 | 3,709 |
| 65 to 69 | 1732 | 1985 | 3,717 |
| 70 to 74 | 1303 | 1516 | 2,819 |
| 75 to 79 | 910 | 1134 | 2,044 |
| 80 to 84 | 548 | 821 | 1,369 |
| 85+ | 351 | 810 | 1,161 |
Hamblen County resident population estimates by Sex, Race, and Hispanic Origin[1b]. For full list of abbrevations see: population.us/about page.
| Race | Male | Female | Total |
| WAC | 28599 | 30221 | 58,820 |
| WA | 28127 | 29665 | 57,792 |
| NH | 27024 | 29172 | 56,196 |
| NHWAC | 25350 | 27477 | 52,827 |
| NHWA | 24968 | 26986 | 51,954 |
| H | 3706 | 3134 | 6,840 |
| HWAC | 3249 | 2744 | 5,993 |
| HWA | 3159 | 2679 | 5,838 |
| BAC | 1720 | 1800 | 3,520 |
| NHBAC | 1497 | 1587 | 3,084 |
| BA | 1432 | 1431 | 2,863 |
| NHBA | 1258 | 1258 | 2,516 |
| TOM | 512 | 602 | 1,114 |
| NHTOM | 413 | 530 | 943 |
| IAC | 471 | 434 | 905 |
| AAC | 369 | 392 | 761 |
| NHAAC | 326 | 358 | 684 |
| AA | 299 | 308 | 607 |
| NHAA | 271 | 285 | 556 |
| IA | 290 | 242 | 532 |
| HIAC | 278 | 209 | 487 |
| HBAC | 223 | 213 | 436 |
| HIA | 238 | 181 | 419 |
| NHIAC | 193 | 225 | 418 |
| HBA | 174 | 173 | 347 |
| NAC | 103 | 85 | 188 |
| HTOM | 99 | 72 | 171 |
| NHNAC | 87 | 76 | 163 |
| NA | 70 | 58 | 128 |
| NHNA | 62 | 52 | 114 |
| NHIA | 52 | 61 | 113 |
| HAAC | 43 | 34 | 77 |
| HAA | 28 | 23 | 51 |
| HNAC | 16 | 9 | 25 |
| HNA | 8 | 6 | 14 |
• Sevier County population
32 mi,  205°
205°
• Greene County
23.5 mi,  96°
96°
• Hawkins County
24.7 mi,  49°
49°
• Jefferson County
15.3 mi,  219°
219°
• Cocke County
22.4 mi,  158°
158°
• Claiborne County
29.4 mi,  311°
311°
• Lee County
34.2 mi,  12°
12°
• Grainger County
14.2 mi,  286°
286°
• Union County
32.1 mi,  278°
278°
• Hancock County
21 mi, 5°
[0] Calculated by population.us from last known population growth rate, not official data.
[1] County population - 2014, archived from the original, retrieved 02/23/2016
[1b] Annual County Resident Population Estimates by Age, Sex, Race, and Hispanic Origin, (used only data for 2014) archived from the original, retrieved 02/23/2016
[2] County population - 2000-2010, archived from the original, retrieved 02/23/2016
[3] Population of States and Counties of the United States: 1790 to 1992, PDF, 15 Mb, census.gov, retrieved 02/23/2016
[4] County area, latitude longitude data, retrieved 02/23/2016
[5] County boundaries, CSV files on boundaries.us, retrived 03/18/2016
See note 17 Tennessee Notes
Page generated in 0.011 seconds© 2016 population.us | Terms of use | Contact