Last official estimated population of Haywood County was 18,764 (year 2014)[1]. This was 0.006% of total US population and 0.3% of total Tennessee state population. Area of Haywood County is 534.1 mi² (=1383.2 km²), in this year population density was 35.13 p/mi². If population growth rate would be same as in period 2010-2014 (-0.03%/yr), Haywood County population in 2026 would be 18,695 [0].
Historical population of Haywood County for period 1830-2014 [1] , [2] , [3]:
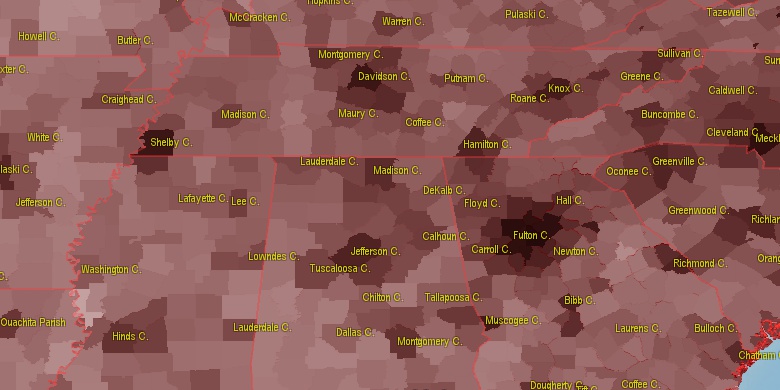
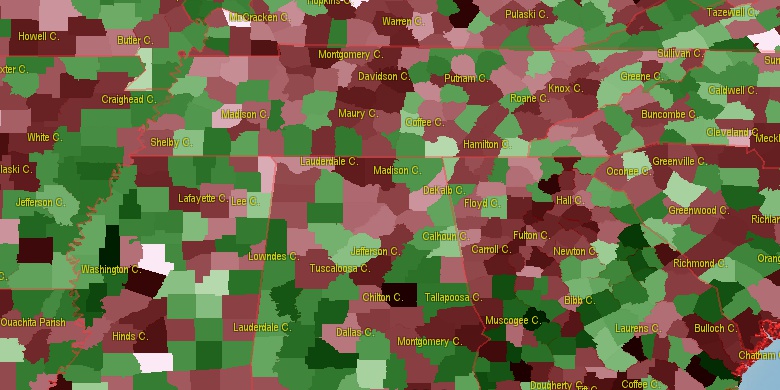
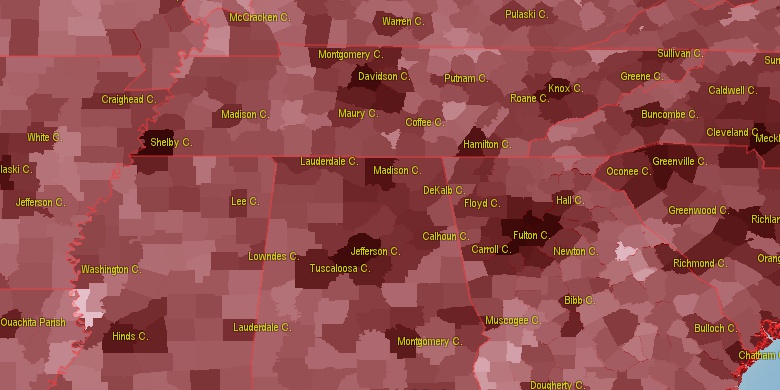
Estimated population for 2014[1]. Population density is in p./sq.mi [4]. Changes are for period 2010-2015. Value is %/year. Boundary lines are approx. 2012 [5]. Click on flag to hide it.
Population • Density • Changes • Legends • Position

[1830-1840] +10.03 %/yr
[1840-1850] +2.21 %/yr
[1850-1860] +1.09 %/yr
[1860-1870] +2.7 %/yr
[1870-1880] +0.38 %/yr
[1880-1890] -1 %/yr
[1890-1900] +0.67 %/yr
[1900-1910] +0.28 %/yr
[1910-1920] -0.2 %/yr
[1920-1930] +0.26 %/yr
[1930-1940] +0.61 %/yr
[1940-1950] -0.55 %/yr
[1950-1960] -1.13 %/yr
[1960-1970] -1.76 %/yr
[1970-1980] +0.36 %/yr
[1980-1990] -0.44 %/yr
[1990-2000] +0.18 %/yr
[2000-2005] -0.41 %/yr
[2005-2010] -0.63 %/yr
[2010-2014] -0.03 %/yr
Looking for settlements in Haywood County? Visit this page: Settlements in Haywood County, TN
Population of Haywood County by age groups male (M) and female (F)[1b]
| Age Gr. | (M) | (F) | Total |
| 0 to 4 | 517 | 540 | 1,057 |
| 5 to 9 | 613 | 608 | 1,221 |
| 10 to 14 | 619 | 664 | 1,283 |
| 15 to 19 | 595 | 573 | 1,168 |
| 20 to 24 | 580 | 586 | 1,166 |
| 25 to 29 | 481 | 539 | 1,020 |
| 30 to 34 | 485 | 551 | 1,036 |
| 35 to 39 | 452 | 590 | 1,042 |
| 40 to 44 | 482 | 555 | 1,037 |
| 45 to 49 | 543 | 632 | 1,175 |
| 50 to 54 | 624 | 719 | 1,343 |
| 55 to 59 | 624 | 783 | 1,407 |
| 60 to 64 | 628 | 683 | 1,311 |
| 65 to 69 | 474 | 506 | 980 |
| 70 to 74 | 301 | 406 | 707 |
| 75 to 79 | 191 | 304 | 495 |
| 80 to 84 | 132 | 218 | 350 |
| 85+ | 106 | 281 | 387 |
Haywood County resident population estimates by Sex, Race, and Hispanic Origin[1b]. For full list of abbrevations see: population.us/about page.
| Race | Male | Female | Total |
| NH | 8050 | 9376 | 17,426 |
| BAC | 4132 | 5056 | 9,188 |
| NHBAC | 4084 | 5001 | 9,085 |
| BA | 4077 | 4993 | 9,070 |
| WAC | 4314 | 4689 | 9,003 |
| NHBA | 4032 | 4940 | 8,972 |
| WA | 4236 | 4598 | 8,834 |
| NHWAC | 3987 | 4395 | 8,382 |
| NHWA | 3916 | 4310 | 8,226 |
| H | 397 | 362 | 759 |
| HWAC | 327 | 294 | 621 |
| HWA | 320 | 288 | 608 |
| TOM | 82 | 94 | 176 |
| NHTOM | 75 | 88 | 163 |
| IAC | 55 | 58 | 113 |
| HBAC | 48 | 55 | 103 |
| HBA | 45 | 53 | 98 |
| NHIAC | 34 | 40 | 74 |
| IA | 33 | 32 | 65 |
| AAC | 26 | 28 | 54 |
| NHAAC | 20 | 28 | 48 |
| HIAC | 21 | 18 | 39 |
| AA | 17 | 21 | 38 |
| NHIA | 16 | 17 | 33 |
| HIA | 17 | 15 | 32 |
| NHAA | 11 | 21 | 32 |
| HTOM | 7 | 6 | 13 |
| NAC | 4 | 5 | 9 |
| HAAC | 6 | 0 | 6 |
| HAA | 6 | 0 | 6 |
| NHNAC | 1 | 4 | 5 |
| HNAC | 3 | 1 | 4 |
| HNA | 2 | 0 | 2 |
| NA | 2 | 0 | 2 |
| NHNA | 0 | 0 | 0 |
• Shelby County population
44.3 mi,  231°
231°
• Madison County
25.3 mi,  86°
86°
• Tipton County
27.9 mi,  257°
257°
• Gibson County
34.1 mi,  34°
34°
• Fayette County
27.9 mi,  195°
195°
• Dyer County
32.9 mi,  348°
348°
• Lauderdale County
22.9 mi,  302°
302°
• Hardeman County
30.3 mi,  146°
146°
• Chester County
39.5 mi,  106°
106°
• Crockett County
18.1 mi, 27°
[0] Calculated by population.us from last known population growth rate, not official data.
[1] County population - 2014, archived from the original, retrieved 02/23/2016
[1b] Annual County Resident Population Estimates by Age, Sex, Race, and Hispanic Origin, (used only data for 2014) archived from the original, retrieved 02/23/2016
[2] County population - 2000-2010, archived from the original, retrieved 02/23/2016
[3] Population of States and Counties of the United States: 1790 to 1992, PDF, 15 Mb, census.gov, retrieved 02/23/2016
[4] County area, latitude longitude data, retrieved 02/23/2016
[5] County boundaries, CSV files on boundaries.us, retrived 03/18/2016
Page generated in 0.019 seconds© 2016 population.us | Terms of use | Contact