Last official estimated population of Johnson County was 18,281 (year 2014)[1]. This was 0.006% of total US population and 0.3% of total Tennessee state population. Area of Johnson County is 302.7 mi² (=784 km²), in this year population density was 60.39 p/mi². If population growth rate would be same as in period 2010-2014 (+0.05%/yr), Johnson County population in 2026 would be 18,392 [0].
Historical population of Johnson County for period 1840-2014 [1] , [2] , [3]:
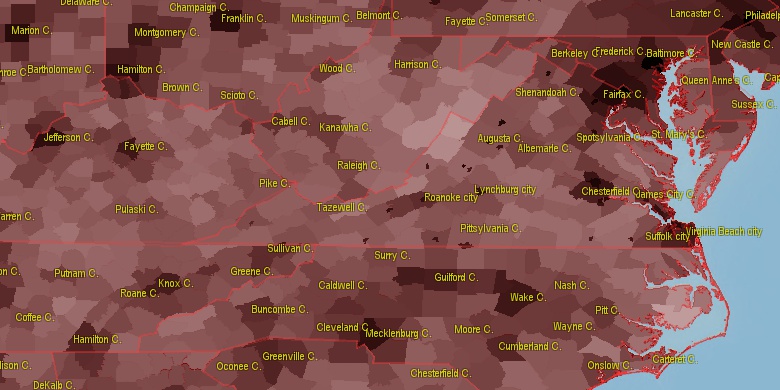
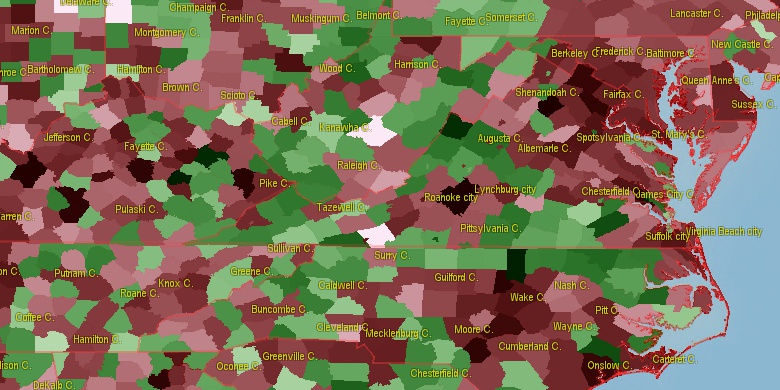
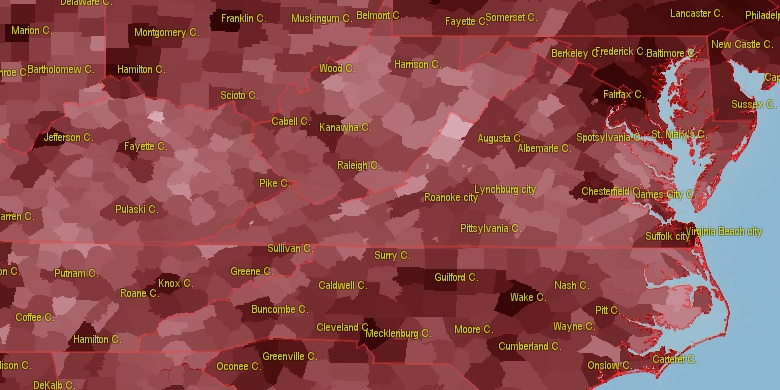
Estimated population for 2014[1]. Population density is in p./sq.mi [4]. Changes are for period 2010-2015. Value is %/year. Boundary lines are approx. 2012 [5]. Click on flag to hide it.
Population • Density • Changes • Legends • Position

[1840-1850] +3.38 %/yr
[1850-1860] +3.08 %/yr
[1860-1870] +1.55 %/yr
[1870-1880] +2.87 %/yr
[1880-1890] +1.32 %/yr
[1890-1900] +1.8 %/yr
[1900-1910] +2.22 %/yr
[1910-1920] -0.75 %/yr
[1920-1930] -0.02 %/yr
[1930-1940] +0.63 %/yr
[1940-1950] -0.57 %/yr
[1950-1960] -1.31 %/yr
[1960-1970] +0.72 %/yr
[1970-1980] +1.74 %/yr
[1980-1990] +0.02 %/yr
[1990-2000] +2.44 %/yr
[2000-2005] +0.72 %/yr
[2005-2010] +0.1 %/yr
[2010-2014] +0.05 %/yr
Looking for settlements in Johnson County? Visit this page: Settlements in Johnson County, TN
Population of Johnson County by age groups male (M) and female (F)[1b]
| Age Gr. | (M) | (F) | Total |
| 0 to 4 | 369 | 392 | 761 |
| 5 to 9 | 447 | 428 | 875 |
| 10 to 14 | 467 | 426 | 893 |
| 15 to 19 | 486 | 437 | 923 |
| 20 to 24 | 638 | 401 | 1,039 |
| 25 to 29 | 587 | 403 | 990 |
| 30 to 34 | 740 | 407 | 1,147 |
| 35 to 39 | 580 | 465 | 1,045 |
| 40 to 44 | 824 | 506 | 1,330 |
| 45 to 49 | 846 | 553 | 1,399 |
| 50 to 54 | 668 | 605 | 1,273 |
| 55 to 59 | 605 | 649 | 1,254 |
| 60 to 64 | 607 | 655 | 1,262 |
| 65 to 69 | 647 | 672 | 1,319 |
| 70 to 74 | 472 | 478 | 950 |
| 75 to 79 | 306 | 358 | 664 |
| 80 to 84 | 154 | 231 | 385 |
| 85+ | 109 | 241 | 350 |
Johnson County resident population estimates by Sex, Race, and Hispanic Origin[1b]. For full list of abbrevations see: population.us/about page.
| Race | Male | Female | Total |
| NH | 9368 | 8169 | 17,537 |
| WAC | 9120 | 8218 | 17,338 |
| WA | 9037 | 8120 | 17,157 |
| NHWAC | 8949 | 8083 | 17,032 |
| NHWA | 8869 | 7990 | 16,859 |
| BAC | 412 | 81 | 493 |
| NHBAC | 402 | 78 | 480 |
| BA | 377 | 41 | 418 |
| NHBA | 368 | 40 | 408 |
| H | 184 | 138 | 322 |
| HWAC | 171 | 135 | 306 |
| HWA | 168 | 130 | 298 |
| TOM | 86 | 99 | 185 |
| NHTOM | 83 | 94 | 177 |
| IAC | 69 | 67 | 136 |
| NHIAC | 65 | 65 | 130 |
| AAC | 33 | 35 | 68 |
| NHAAC | 33 | 33 | 66 |
| AA | 20 | 26 | 46 |
| NHAA | 20 | 26 | 46 |
| IA | 27 | 18 | 45 |
| NHIA | 25 | 17 | 42 |
| NAC | 10 | 8 | 18 |
| NHNAC | 8 | 7 | 15 |
| HBAC | 10 | 3 | 13 |
| HBA | 9 | 1 | 10 |
| NA | 5 | 3 | 8 |
| HTOM | 3 | 5 | 8 |
| HIAC | 4 | 2 | 6 |
| NHNA | 3 | 2 | 5 |
| HNAC | 2 | 1 | 3 |
| HNA | 2 | 1 | 3 |
| HIA | 2 | 1 | 3 |
| HAAC | 0 | 2 | 2 |
| HAA | 0 | 0 | 0 |
• Sullivan County population
24.7 mi,  279°
279°
• Carter County
18.8 mi,  231°
231°
• Washington County
20.9 mi,  346°
346°
• Watauga County
17.2 mi,  150°
150°
• Smyth County
32.3 mi,  33°
33°
• Russell County
35.6 mi,  338°
338°
• Ashe County
20.1 mi,  91°
91°
• Bristol city
20 mi,  304°
304°
• Avery County
26.5 mi,  187°
187°
• Mitchell County
34.8 mi,  208°
208°
[0] Calculated by population.us from last known population growth rate, not official data.
[1] County population - 2014, archived from the original, retrieved 02/23/2016
[1b] Annual County Resident Population Estimates by Age, Sex, Race, and Hispanic Origin, (used only data for 2014) archived from the original, retrieved 02/23/2016
[2] County population - 2000-2010, archived from the original, retrieved 02/23/2016
[3] Population of States and Counties of the United States: 1790 to 1992, PDF, 15 Mb, census.gov, retrieved 02/23/2016
[4] County area, latitude longitude data, retrieved 02/23/2016
[5] County boundaries, CSV files on boundaries.us, retrived 03/18/2016
*Carter Tennessee Notes
Page generated in 0.016 seconds© 2016 population.us | Terms of use | Contact