Last official estimated population of Lake County was 7,817 (year 2014)[1]. This was 0.002% of total US population and 0.1% of total Tennessee state population. Area of Lake County is 193.9 mi² (=502.2 km²), in this year population density was 40.32 p/mi². If population growth rate would be same as in period 2010-2014 (-0.05%/yr), Lake County population in 2026 would be 7,772 [0].
Historical population of Lake County for period 1870-2014 [1] , [2] , [3]:
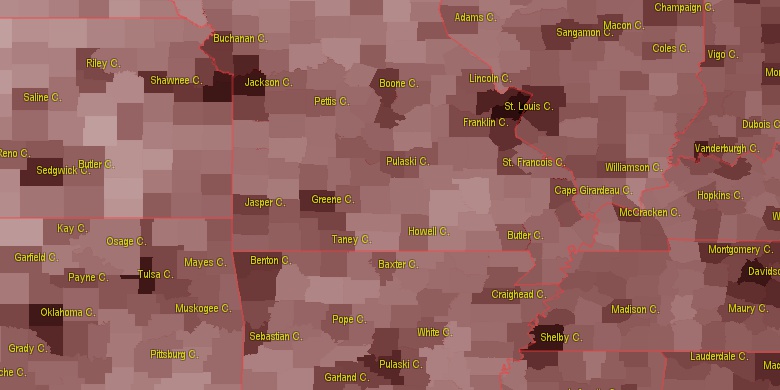
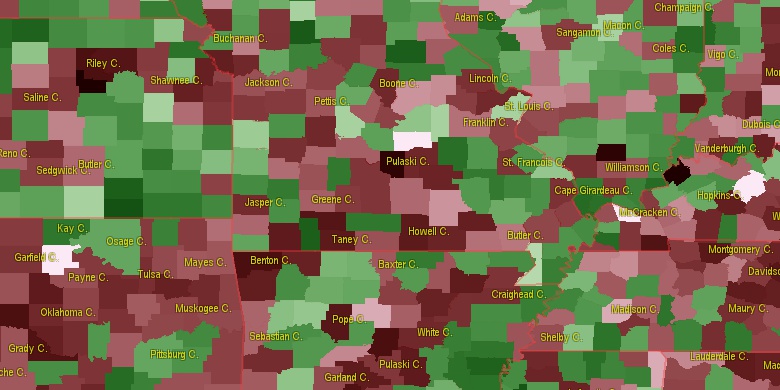
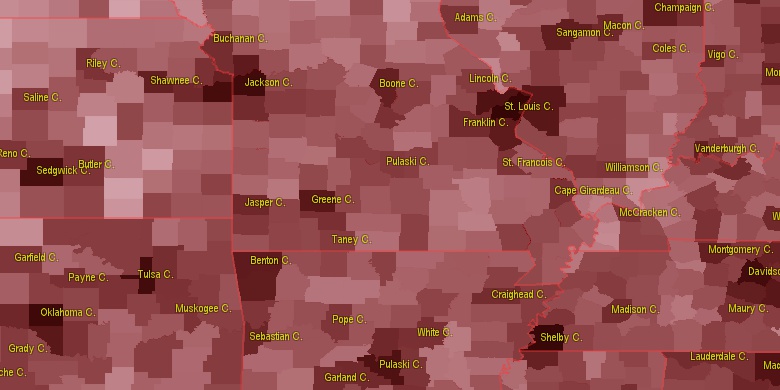
Estimated population for 2014[1]. Population density is in p./sq.mi [4]. Changes are for period 2010-2015. Value is %/year. Boundary lines are approx. 2012 [5]. Click on flag to hide it.
Population • Density • Changes • Legends • Position

[1870-1880] +5.03 %/yr
[1880-1890] +2.94 %/yr
[1890-1900] +3.34 %/yr
[1900-1910] +1.68 %/yr
[1910-1920] +0.42 %/yr
[1920-1930] +1.46 %/yr
[1930-1940] +0.69 %/yr
[1940-1950] +0.37 %/yr
[1950-1960] -1.95 %/yr
[1960-1970] -1.91 %/yr
[1970-1980] -0.57 %/yr
[1980-1990] -0.45 %/yr
[1990-2000] +1.1 %/yr
[2000-2005] -0.26 %/yr
[2005-2010] -0.04 %/yr
[2010-2014] -0.05 %/yr
Looking for settlements in Lake County? Visit this page: Settlements in Lake County, TN
Population of Lake County by age groups male (M) and female (F)[1b]
| Age Gr. | (M) | (F) | Total |
| 0 to 4 | 158 | 183 | 341 |
| 5 to 9 | 161 | 161 | 322 |
| 10 to 14 | 188 | 126 | 314 |
| 15 to 19 | 260 | 114 | 374 |
| 20 to 24 | 522 | 140 | 662 |
| 25 to 29 | 542 | 149 | 691 |
| 30 to 34 | 483 | 164 | 647 |
| 35 to 39 | 429 | 159 | 588 |
| 40 to 44 | 402 | 171 | 573 |
| 45 to 49 | 356 | 191 | 547 |
| 50 to 54 | 330 | 176 | 506 |
| 55 to 59 | 306 | 221 | 527 |
| 60 to 64 | 226 | 191 | 417 |
| 65 to 69 | 212 | 181 | 393 |
| 70 to 74 | 125 | 115 | 240 |
| 75 to 79 | 80 | 114 | 194 |
| 80 to 84 | 61 | 101 | 162 |
| 85+ | 32 | 101 | 133 |
Lake County resident population estimates by Sex, Race, and Hispanic Origin[1b]. For full list of abbrevations see: population.us/about page.
| Race | Male | Female | Total |
| NH | 4763 | 2713 | 7,476 |
| WAC | 3249 | 2177 | 5,426 |
| WA | 3189 | 2108 | 5,297 |
| NHWAC | 3159 | 2135 | 5,294 |
| NHWA | 3102 | 2070 | 5,172 |
| BAC | 1634 | 599 | 2,233 |
| NHBAC | 1618 | 596 | 2,214 |
| BA | 1588 | 558 | 2,146 |
| NHBA | 1576 | 557 | 2,133 |
| H | 110 | 45 | 155 |
| TOM | 66 | 69 | 135 |
| HWAC | 90 | 42 | 132 |
| NHTOM | 62 | 65 | 127 |
| HWA | 87 | 38 | 125 |
| IAC | 40 | 38 | 78 |
| NHIAC | 34 | 34 | 68 |
| IA | 21 | 16 | 37 |
| NHIA | 15 | 14 | 29 |
| AAC | 11 | 11 | 22 |
| NHAAC | 10 | 11 | 21 |
| HBAC | 16 | 3 | 19 |
| AA | 7 | 7 | 14 |
| NHAA | 7 | 7 | 14 |
| HBA | 12 | 1 | 13 |
| HIAC | 6 | 4 | 10 |
| NAC | 6 | 2 | 8 |
| HIA | 6 | 2 | 8 |
| HTOM | 4 | 4 | 8 |
| NHNAC | 5 | 2 | 7 |
| NA | 2 | 0 | 2 |
| HNAC | 1 | 0 | 1 |
| HNA | 1 | 0 | 1 |
| NHNA | 1 | 0 | 1 |
| HAAC | 1 | 0 | 1 |
| HAA | 0 | 0 | 0 |
• Gibson County population
38.8 mi,  127°
127°
• Dyer County
19.9 mi,  165°
165°
• Dunklin County
34.5 mi,  248°
248°
• Obion County
18.8 mi,  84°
84°
• Lauderdale County
40.2 mi,  191°
191°
• New Madrid County
20.3 mi,  332°
332°
• Pemiscot County
18.8 mi,  242°
242°
• Mississippi County
35.6 mi,  17°
17°
• Fulton County
22.4 mi,  47°
47°
• Hickman County
37 mi, 50°
[0] Calculated by population.us from last known population growth rate, not official data.
[1] County population - 2014, archived from the original, retrieved 02/23/2016
[1b] Annual County Resident Population Estimates by Age, Sex, Race, and Hispanic Origin, (used only data for 2014) archived from the original, retrieved 02/23/2016
[2] County population - 2000-2010, archived from the original, retrieved 02/23/2016
[3] Population of States and Counties of the United States: 1790 to 1992, PDF, 15 Mb, census.gov, retrieved 02/23/2016
[4] County area, latitude longitude data, retrieved 02/23/2016
[5] County boundaries, CSV files on boundaries.us, retrived 03/18/2016
*Obion Tennessee Notes
Page generated in 0.021 seconds© 2016 population.us | Terms of use | Contact