Last official estimated population of Marion County was 28,236 (year 2014)[1]. This was 0.009% of total US population and 0.4% of total Tennessee state population. Area of Marion County is 512.3 mi² (=1326.7 km²), in this year population density was 55.12 p/mi². If population growth rate would be same as in period 2010-2014 (-0%/yr), Marion County population in 2026 would be 28,233 [0].
Historical population of Marion County for period 1820-2014 [1] , [2] , [3]:
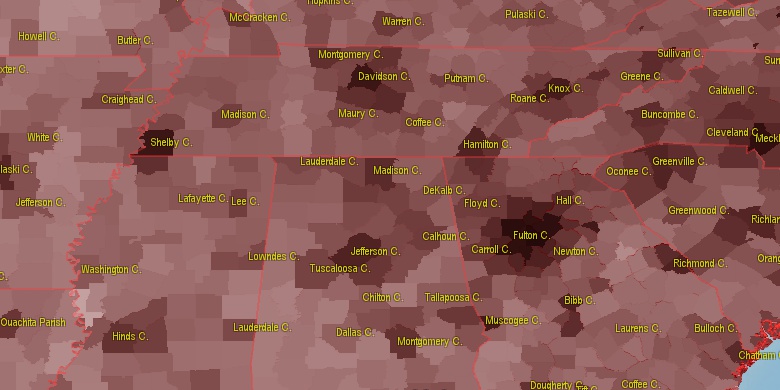
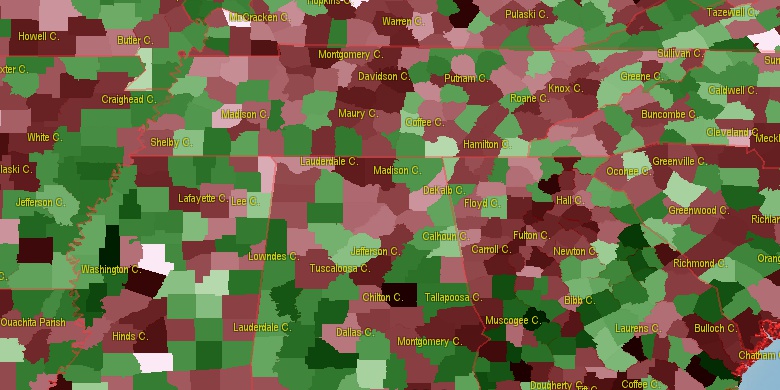
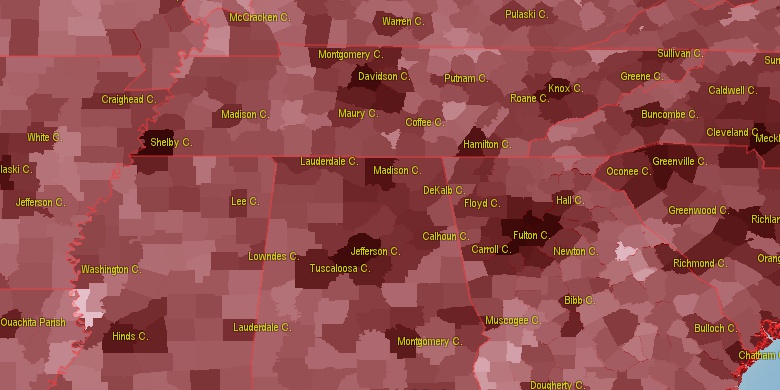
Estimated population for 2014[1]. Population density is in p./sq.mi [4]. Changes are for period 2010-2015. Value is %/year. Boundary lines are approx. 2012 [5]. Click on flag to hide it.
Population • Density • Changes • Legends • Position

[1820-1830] +3.54 %/yr
[1830-1840] +0.98 %/yr
[1840-1850] +0.39 %/yr
[1850-1860] -0.2 %/yr
[1860-1870] +1.01 %/yr
[1870-1880] +4.78 %/yr
[1880-1890] +3.51 %/yr
[1890-1900] +1.15 %/yr
[1900-1910] +0.86 %/yr
[1910-1920] -0.78 %/yr
[1920-1930] +0.08 %/yr
[1930-1940] +0.87 %/yr
[1940-1950] +0.7 %/yr
[1950-1960] +0.25 %/yr
[1960-1970] -0.22 %/yr
[1970-1980] +1.73 %/yr
[1980-1990] +0.11 %/yr
[1990-2000] +1.18 %/yr
[2000-2005] -0.01 %/yr
[2005-2010] +0.35 %/yr
[2010-2014] -0 %/yr
Looking for settlements in Marion County? Visit this page: Settlements in Marion County, TN
Population of Marion County by age groups male (M) and female (F)[1b]
| Age Gr. | (M) | (F) | Total |
| 0 to 4 | 792 | 669 | 1,461 |
| 5 to 9 | 859 | 775 | 1,634 |
| 10 to 14 | 923 | 889 | 1,812 |
| 15 to 19 | 895 | 834 | 1,729 |
| 20 to 24 | 845 | 829 | 1,674 |
| 25 to 29 | 838 | 804 | 1,642 |
| 30 to 34 | 757 | 766 | 1,523 |
| 35 to 39 | 824 | 832 | 1,656 |
| 40 to 44 | 879 | 939 | 1,818 |
| 45 to 49 | 965 | 955 | 1,920 |
| 50 to 54 | 1019 | 1129 | 2,148 |
| 55 to 59 | 1063 | 1152 | 2,215 |
| 60 to 64 | 972 | 1052 | 2,024 |
| 65 to 69 | 884 | 970 | 1,854 |
| 70 to 74 | 627 | 711 | 1,338 |
| 75 to 79 | 372 | 498 | 870 |
| 80 to 84 | 280 | 343 | 623 |
| 85+ | 140 | 326 | 466 |
Marion County resident population estimates by Sex, Race, and Hispanic Origin[1b]. For full list of abbrevations see: population.us/about page.
| Race | Male | Female | Total |
| NH | 13678 | 14254 | 27,932 |
| WAC | 13217 | 13732 | 26,949 |
| WA | 13024 | 13521 | 26,545 |
| NHWAC | 13003 | 13529 | 26,532 |
| NHWA | 12817 | 13327 | 26,144 |
| BAC | 664 | 683 | 1,347 |
| NHBAC | 633 | 674 | 1,307 |
| BA | 569 | 584 | 1,153 |
| NHBA | 541 | 580 | 1,121 |
| H | 256 | 219 | 475 |
| HWAC | 214 | 203 | 417 |
| TOM | 201 | 215 | 416 |
| HWA | 207 | 194 | 401 |
| NHTOM | 194 | 206 | 400 |
| IAC | 157 | 165 | 322 |
| NHIAC | 142 | 153 | 295 |
| AAC | 97 | 97 | 194 |
| NHAAC | 94 | 96 | 190 |
| AA | 73 | 79 | 152 |
| NHAA | 70 | 79 | 149 |
| IA | 67 | 67 | 134 |
| NHIA | 56 | 58 | 114 |
| HBAC | 31 | 9 | 40 |
| HBA | 28 | 4 | 32 |
| HIAC | 15 | 12 | 27 |
| NAC | 8 | 13 | 21 |
| HIA | 11 | 9 | 20 |
| NHNAC | 8 | 10 | 18 |
| HTOM | 7 | 9 | 16 |
| NA | 0 | 7 | 7 |
| HAAC | 3 | 1 | 4 |
| NHNA | 0 | 4 | 4 |
| HAA | 3 | 0 | 3 |
| HNAC | 0 | 3 | 3 |
| HNA | 0 | 3 | 3 |
• Hamilton County population
23.6 mi,  85°
85°
• Walker County
32.7 mi,  147°
147°
• Catoosa County
31.7 mi,  120°
120°
• Jackson County
32.7 mi,  218°
218°
• Coffee County
35.7 mi,  313°
313°
• Franklin County
27.2 mi,  273°
273°
• Warren County
38.7 mi,  346°
346°
• Dade County
20.4 mi,  161°
161°
• Sequatchie County
20.3 mi,  35°
35°
• Grundy County
18.7 mi,  343°
343°
[0] Calculated by population.us from last known population growth rate, not official data.
[1] County population - 2014, archived from the original, retrieved 02/23/2016
[1b] Annual County Resident Population Estimates by Age, Sex, Race, and Hispanic Origin, (used only data for 2014) archived from the original, retrieved 02/23/2016
[2] County population - 2000-2010, archived from the original, retrieved 02/23/2016
[3] Population of States and Counties of the United States: 1790 to 1992, PDF, 15 Mb, census.gov, retrieved 02/23/2016
[4] County area, latitude longitude data, retrieved 02/23/2016
[5] County boundaries, CSV files on boundaries.us, retrived 03/18/2016
Page generated in 0.014 seconds© 2016 population.us | Terms of use | Contact