Last official estimated population of Blanco County was 10,509 (year 2014)[1]. This was 0.003% of total US population and 0% of total Texas state population. Area of Blanco County is 713.4 mi² (=1847.8 km²), in this year population density was 14.73 p/mi². If population growth rate would be same as in period 2010-2014 (+0.03%/yr), Blanco County population in 2026 would be 10,545 [0].
Historical population of Blanco County for period 1860-2014 [1] , [2] , [3]:
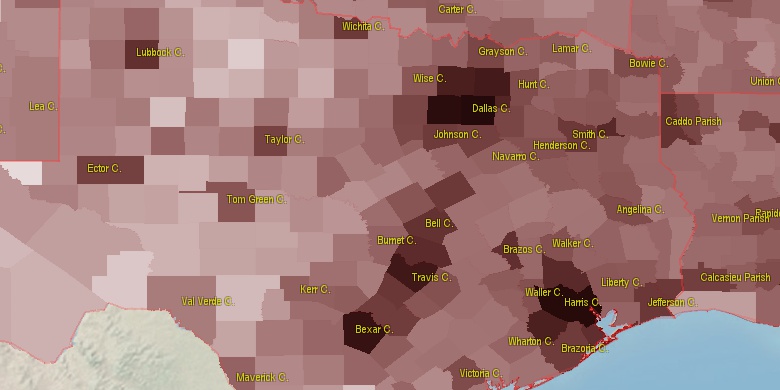
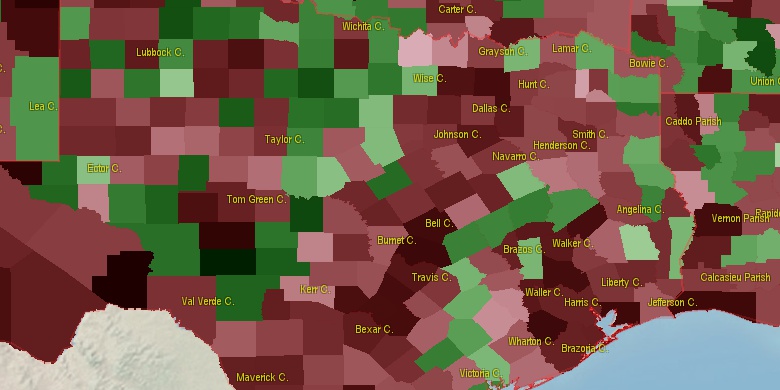
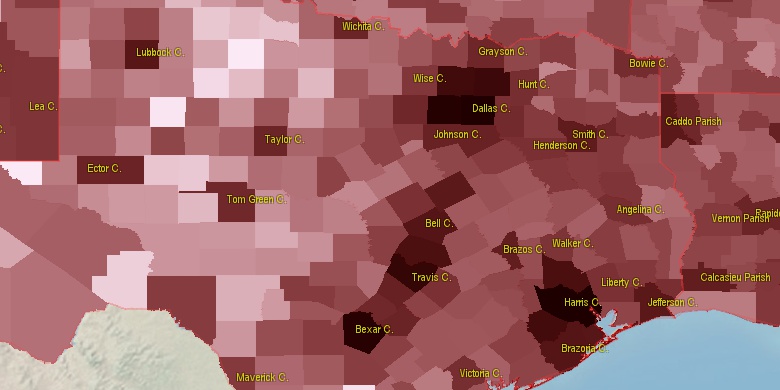
Estimated population for 2014[1]. Population density is in p./sq.mi [4]. Changes are for period 2010-2015. Value is %/year. Boundary lines are approx. 2012 [5]. Click on flag to hide it.
Population • Density • Changes • Legends • Position

[1860-1870] -0.76 %/yr
[1870-1880] +11.68 %/yr
[1880-1890] +2.64 %/yr
[1890-1900] +0.12 %/yr
[1900-1910] -0.87 %/yr
[1910-1920] -0.59 %/yr
[1920-1930] -0.56 %/yr
[1930-1940] +1.05 %/yr
[1940-1950] -1.2 %/yr
[1950-1960] -0.33 %/yr
[1960-1970] -0.25 %/yr
[1970-1980] +2.76 %/yr
[1980-1990] +2.47 %/yr
[1990-2000] +3.51 %/yr
[2000-2005] +2.52 %/yr
[2005-2010] +1.9 %/yr
[2010-2014] +0.03 %/yr
Looking for settlements in Blanco County? Visit this page: Settlements in Blanco County, TX
Population of Blanco County by age groups male (M) and female (F)[1b]
| Age Gr. | (M) | (F) | Total |
| 0 to 4 | 218 | 217 | 435 |
| 5 to 9 | 279 | 276 | 555 |
| 10 to 14 | 363 | 294 | 657 |
| 15 to 19 | 352 | 288 | 640 |
| 20 to 24 | 265 | 224 | 489 |
| 25 to 29 | 236 | 232 | 468 |
| 30 to 34 | 270 | 227 | 497 |
| 35 to 39 | 254 | 237 | 491 |
| 40 to 44 | 321 | 329 | 650 |
| 45 to 49 | 328 | 339 | 667 |
| 50 to 54 | 451 | 432 | 883 |
| 55 to 59 | 473 | 489 | 962 |
| 60 to 64 | 485 | 510 | 995 |
| 65 to 69 | 416 | 450 | 866 |
| 70 to 74 | 328 | 328 | 656 |
| 75 to 79 | 188 | 197 | 385 |
| 80 to 84 | 132 | 121 | 253 |
| 85+ | 92 | 171 | 263 |
Blanco County resident population estimates by Sex, Race, and Hispanic Origin[1b]. For full list of abbrevations see: population.us/about page.
| Race | Male | Female | Total |
| WAC | 5257 | 5217 | 10,474 |
| WA | 5176 | 5158 | 10,334 |
| NH | 4362 | 4414 | 8,776 |
| NHWAC | 4237 | 4322 | 8,559 |
| NHWA | 4180 | 4279 | 8,459 |
| H | 1089 | 947 | 2,036 |
| HWAC | 1020 | 895 | 1,915 |
| HWA | 996 | 879 | 1,875 |
| IAC | 132 | 78 | 210 |
| BAC | 109 | 68 | 177 |
| IA | 91 | 55 | 146 |
| TOM | 83 | 62 | 145 |
| NHBAC | 94 | 46 | 140 |
| BA | 79 | 43 | 122 |
| HIAC | 72 | 35 | 107 |
| NHTOM | 58 | 46 | 104 |
| NHIAC | 60 | 43 | 103 |
| NHBA | 73 | 28 | 101 |
| HIA | 59 | 29 | 88 |
| AAC | 33 | 47 | 80 |
| NHAAC | 27 | 41 | 68 |
| NHIA | 32 | 26 | 58 |
| AA | 20 | 34 | 54 |
| NHAA | 18 | 30 | 48 |
| HTOM | 25 | 16 | 41 |
| HBAC | 15 | 22 | 37 |
| HBA | 6 | 15 | 21 |
| NAC | 3 | 13 | 16 |
| HAAC | 6 | 6 | 12 |
| NA | 2 | 9 | 11 |
| NHNAC | 2 | 8 | 10 |
| HAA | 2 | 4 | 6 |
| HNAC | 1 | 5 | 6 |
| NHNA | 1 | 5 | 6 |
| HNA | 1 | 4 | 5 |
• Travis County population
42.3 mi,  92°
92°
• Williamson County
54.2 mi,  60°
60°
• Hays County
26.3 mi,  122°
122°
• Guadalupe County
54.4 mi,  150°
150°
• Comal County
32.9 mi,  165°
165°
• Burnet County
38 mi,  18°
18°
• Caldwell County
55 mi, 123°
• Kendall County
29 mi,  219°
219°
• Gillespie County
32.6 mi,  277°
277°
• Llano County
34.9 mi,  330°
330°
[0] Calculated by population.us from last known population growth rate, not official data.
[1] County population - 2014, archived from the original, retrieved 02/23/2016
[1b] Annual County Resident Population Estimates by Age, Sex, Race, and Hispanic Origin, (used only data for 2014) archived from the original, retrieved 02/23/2016
[2] County population - 2000-2010, archived from the original, retrieved 02/23/2016
[3] Population of States and Counties of the United States: 1790 to 1992, PDF, 15 Mb, census.gov, retrieved 02/23/2016
[4] County area, latitude longitude data, retrieved 02/23/2016
[5] County boundaries, CSV files on boundaries.us, retrived 03/18/2016
*Comal, Hays, Travis, Bexar Texas Notes
Page generated in 0.019 seconds© 2016 population.us | Terms of use | Contact