Last official estimated population of Burleson County was 17,210 (year 2014)[1]. This was 0.005% of total US population and 0.1% of total Texas state population. Area of Burleson County is 676.8 mi² (=1752.9 km²), in this year population density was 25.43 p/mi². If population growth rate would be same as in period 2010-2014 (+0.03%/yr), Burleson County population in 2026 would be 17,279 [0].
Historical population of Burleson County for period 1850-2014 [1] , [2] , [3]:
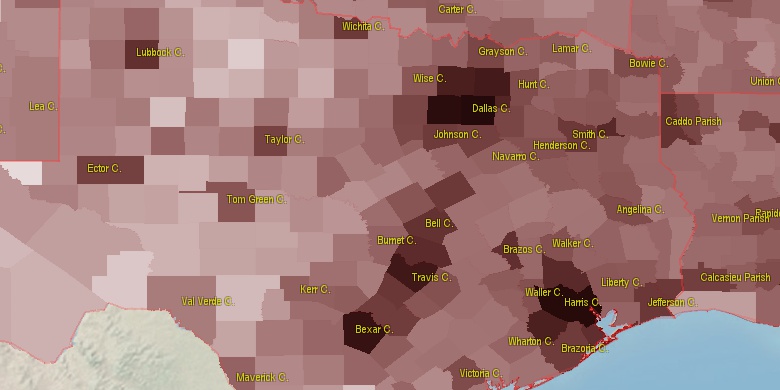
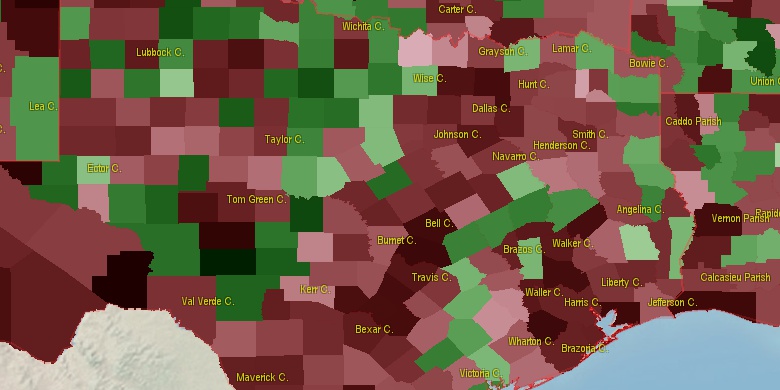
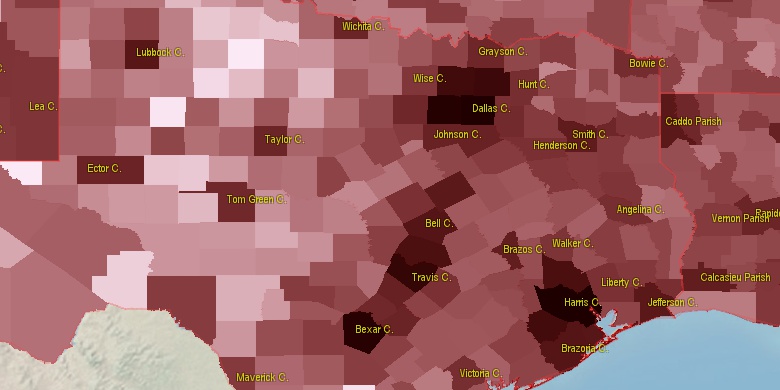
Estimated population for 2014[1]. Population density is in p./sq.mi [4]. Changes are for period 2010-2015. Value is %/year. Boundary lines are approx. 2012 [5]. Click on flag to hide it.
Population • Density • Changes • Legends • Position

[1850-1860] +12.74 %/yr
[1860-1870] +3.57 %/yr
[1870-1880] +1.36 %/yr
[1880-1890] +3.47 %/yr
[1890-1900] +3.52 %/yr
[1900-1910] +0.17 %/yr
[1910-1920] -1.03 %/yr
[1920-1930] +1.65 %/yr
[1930-1940] -0.79 %/yr
[1940-1950] -3.38 %/yr
[1950-1960] -1.5 %/yr
[1960-1970] -1.11 %/yr
[1970-1980] +2.1 %/yr
[1980-1990] +1.02 %/yr
[1990-2000] +1.9 %/yr
[2000-2005] +0.86 %/yr
[2005-2010] +0.02 %/yr
[2010-2014] +0.03 %/yr
Looking for settlements in Burleson County? Visit this page: Settlements in Burleson County, TX
Population of Burleson County by age groups male (M) and female (F)[1b]
| Age Gr. | (M) | (F) | Total |
| 0 to 4 | 531 | 490 | 1,021 |
| 5 to 9 | 598 | 542 | 1,140 |
| 10 to 14 | 583 | 510 | 1,093 |
| 15 to 19 | 539 | 510 | 1,049 |
| 20 to 24 | 483 | 490 | 973 |
| 25 to 29 | 444 | 428 | 872 |
| 30 to 34 | 453 | 477 | 930 |
| 35 to 39 | 415 | 458 | 873 |
| 40 to 44 | 452 | 461 | 913 |
| 45 to 49 | 571 | 556 | 1,127 |
| 50 to 54 | 664 | 641 | 1,305 |
| 55 to 59 | 668 | 721 | 1,389 |
| 60 to 64 | 622 | 635 | 1,257 |
| 65 to 69 | 539 | 531 | 1,070 |
| 70 to 74 | 381 | 349 | 730 |
| 75 to 79 | 263 | 303 | 566 |
| 80 to 84 | 198 | 286 | 484 |
| 85+ | 174 | 287 | 461 |
Burleson County resident population estimates by Sex, Race, and Hispanic Origin[1b]. For full list of abbrevations see: population.us/about page.
| Race | Male | Female | Total |
| WAC | 7345 | 7389 | 14,734 |
| WA | 7225 | 7273 | 14,498 |
| NH | 6775 | 7007 | 13,782 |
| NHWAC | 5657 | 5830 | 11,487 |
| NHWA | 5556 | 5730 | 11,286 |
| H | 1803 | 1668 | 3,471 |
| HWAC | 1688 | 1559 | 3,247 |
| HWA | 1669 | 1543 | 3,212 |
| BAC | 1181 | 1207 | 2,388 |
| NHBAC | 1124 | 1160 | 2,284 |
| BA | 1112 | 1142 | 2,254 |
| NHBA | 1065 | 1105 | 2,170 |
| IAC | 131 | 143 | 274 |
| TOM | 125 | 127 | 252 |
| NHTOM | 106 | 109 | 215 |
| IA | 91 | 91 | 182 |
| HIAC | 73 | 71 | 144 |
| NHIAC | 58 | 72 | 130 |
| HIA | 64 | 65 | 129 |
| HBAC | 57 | 47 | 104 |
| AAC | 40 | 55 | 95 |
| NHAAC | 37 | 51 | 88 |
| HBA | 47 | 37 | 84 |
| AA | 22 | 37 | 59 |
| NHAA | 20 | 34 | 54 |
| NHIA | 27 | 26 | 53 |
| HTOM | 19 | 18 | 37 |
| NAC | 8 | 10 | 18 |
| NHNAC | 6 | 5 | 11 |
| NA | 3 | 5 | 8 |
| HAAC | 3 | 4 | 7 |
| HNAC | 2 | 5 | 7 |
| HAA | 2 | 3 | 5 |
| HNA | 2 | 2 | 4 |
| NHNA | 1 | 3 | 4 |
• Brazos County population
22.1 mi,  59°
59°
• Bastrop County
49.2 mi,  236°
236°
• Waller County
50.6 mi,  130°
130°
• Washington County
23 mi,  146°
146°
• Austin County
46.6 mi, 153°
• Grimes County
37.9 mi,  84°
84°
• Milam County
29.8 mi,  313°
313°
• Fayette County
46.1 mi,  202°
202°
• Lee County
24.2 mi, 240°
• Robertson County
37.3 mi,  9°
9°
[0] Calculated by population.us from last known population growth rate, not official data.
[1] County population - 2014, archived from the original, retrieved 02/23/2016
[1b] Annual County Resident Population Estimates by Age, Sex, Race, and Hispanic Origin, (used only data for 2014) archived from the original, retrieved 02/23/2016
[2] County population - 2000-2010, archived from the original, retrieved 02/23/2016
[3] Population of States and Counties of the United States: 1790 to 1992, PDF, 15 Mb, census.gov, retrieved 02/23/2016
[4] County area, latitude longitude data, retrieved 02/23/2016
[5] County boundaries, CSV files on boundaries.us, retrived 03/18/2016
Page generated in 0.017 seconds© 2016 population.us | Terms of use | Contact