Last official estimated population of La Salle County was 6,898 (year 2014)[1]. This was 0.002% of total US population and 0% of total Texas state population. Area of La Salle County is 1,494.2 mi² (=3870.1 km²), in this year population density was 4.62 p/mi². If population growth rate would be same as in period 2010-2014 (+0.04%/yr), La Salle County population in 2026 would be 6,934 [0].
Historical population of La Salle County for period 1870-2014 [1] , [2] , [3]:
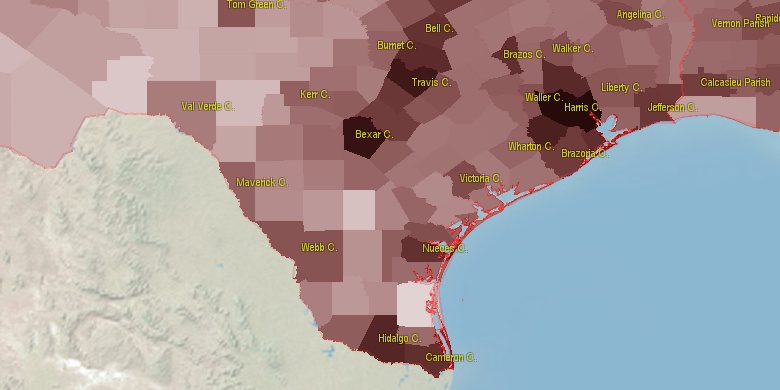
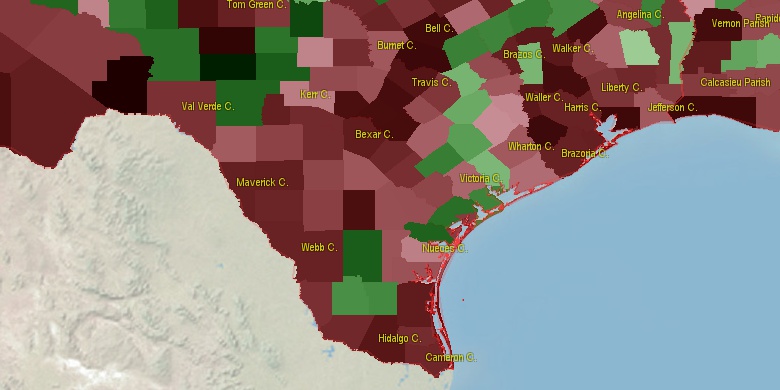
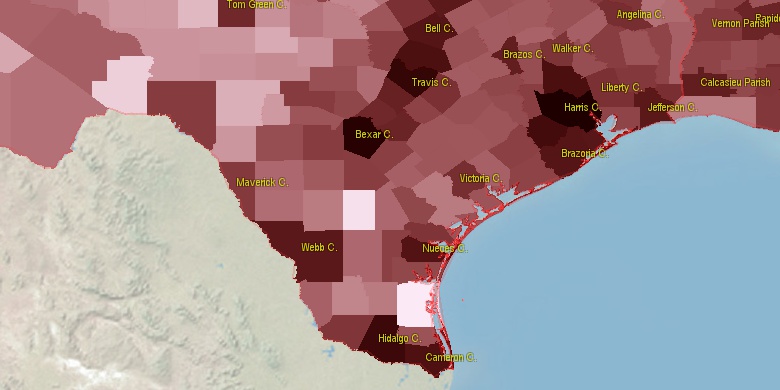
Estimated population for 2014[1]. Population density is in p./sq.mi [4]. Changes are for period 2010-2015. Value is %/year. Boundary lines are approx. 2012 [5]. Click on flag to hide it.
Population • Density • Changes • Legends • Position

[1870-1880] +27.59 %/yr
[1880-1890] +10.49 %/yr
[1890-1900] +0.74 %/yr
[1900-1910] +7.5 %/yr
[1910-1920] +0.15 %/yr
[1920-1930] +5.49 %/yr
[1930-1940] -0.28 %/yr
[1940-1950] -0.67 %/yr
[1950-1960] -2.23 %/yr
[1960-1970] -1.73 %/yr
[1970-1980] +0.96 %/yr
[1980-1990] -0.48 %/yr
[1990-2000] +1.1 %/yr
[2000-2005] +2.22 %/yr
[2005-2010] +1.03 %/yr
[2010-2014] +0.04 %/yr
Looking for settlements in La Salle County? Visit this page: Settlements in La Salle County, TX
Population of La Salle County by age groups male (M) and female (F)[1b]
| Age Gr. | (M) | (F) | Total |
| 0 to 4 | 230 | 274 | 504 |
| 5 to 9 | 222 | 184 | 406 |
| 10 to 14 | 186 | 211 | 397 |
| 15 to 19 | 253 | 185 | 438 |
| 20 to 24 | 904 | 260 | 1,164 |
| 25 to 29 | 601 | 195 | 796 |
| 30 to 34 | 314 | 177 | 491 |
| 35 to 39 | 224 | 169 | 393 |
| 40 to 44 | 246 | 187 | 433 |
| 45 to 49 | 235 | 197 | 432 |
| 50 to 54 | 196 | 173 | 369 |
| 55 to 59 | 156 | 183 | 339 |
| 60 to 64 | 155 | 174 | 329 |
| 65 to 69 | 167 | 160 | 327 |
| 70 to 74 | 116 | 130 | 246 |
| 75 to 79 | 87 | 96 | 183 |
| 80 to 84 | 63 | 71 | 134 |
| 85+ | 35 | 58 | 93 |
La Salle County resident population estimates by Sex, Race, and Hispanic Origin[1b]. For full list of abbrevations see: population.us/about page.
| Race | Male | Female | Total |
| WAC | 4286 | 3003 | 7,289 |
| WA | 4256 | 2982 | 7,238 |
| H | 3782 | 2525 | 6,307 |
| HWAC | 3744 | 2488 | 6,232 |
| HWA | 3723 | 2477 | 6,200 |
| NH | 608 | 559 | 1,167 |
| NHWAC | 542 | 515 | 1,057 |
| NHWA | 533 | 505 | 1,038 |
| BAC | 60 | 41 | 101 |
| IAC | 51 | 40 | 91 |
| BA | 48 | 32 | 80 |
| IA | 37 | 24 | 61 |
| TOM | 33 | 24 | 57 |
| NHBAC | 35 | 18 | 53 |
| HBAC | 25 | 23 | 48 |
| HIAC | 27 | 20 | 47 |
| AAC | 24 | 23 | 47 |
| NHIAC | 24 | 20 | 44 |
| NHBA | 30 | 11 | 41 |
| HBA | 18 | 21 | 39 |
| NHAAC | 19 | 19 | 38 |
| AA | 16 | 20 | 36 |
| HTOM | 21 | 12 | 33 |
| NHIA | 19 | 13 | 32 |
| NHAA | 14 | 18 | 32 |
| HIA | 18 | 11 | 29 |
| NHTOM | 12 | 12 | 24 |
| HAAC | 5 | 4 | 9 |
| HNAC | 4 | 2 | 6 |
| NAC | 4 | 2 | 6 |
| HAA | 2 | 2 | 4 |
| HNA | 0 | 2 | 2 |
| NA | 0 | 2 | 2 |
| NHNA | 0 | 0 | 0 |
| NHNAC | 0 | 0 | 0 |
• Webb County population
43.4 mi,  200°
200°
• Medina County
69.3 mi,  359°
359°
• Atascosa County
50.5 mi,  42°
42°
• Jim Wells County
74.7 mi,  124°
124°
• Frio County
35.8 mi, 358°
• Zavala County
53.6 mi,  311°
311°
• Duval County
59 mi,  141°
141°
• Live Oak County
59 mi,  89°
89°
• Dimmit County
41 mi,  277°
277°
• McMullen County
31.6 mi, 85°
[0] Calculated by population.us from last known population growth rate, not official data.
[1] County population - 2014, archived from the original, retrieved 02/23/2016
[1b] Annual County Resident Population Estimates by Age, Sex, Race, and Hispanic Origin, (used only data for 2014) archived from the original, retrieved 02/23/2016
[2] County population - 2000-2010, archived from the original, retrieved 02/23/2016
[3] Population of States and Counties of the United States: 1790 to 1992, PDF, 15 Mb, census.gov, retrieved 02/23/2016
[4] County area, latitude longitude data, retrieved 02/23/2016
[5] County boundaries, CSV files on boundaries.us, retrived 03/18/2016
Page generated in 0.02 seconds© 2016 population.us | Terms of use | Contact