Last official estimated population of Newton County was 14,439 (year 2014)[1]. This was 0.005% of total US population and 0.1% of total Texas state population. Area of Newton County is 939.7 mi² (=2433.9 km²), in this year population density was 15.37 p/mi². If population growth rate would be same as in period 2010-2014 (-0.01%/yr), Newton County population in 2026 would be 14,421 [0].
Historical population of Newton County for period 1850-2014 [1] , [2] , [3]:
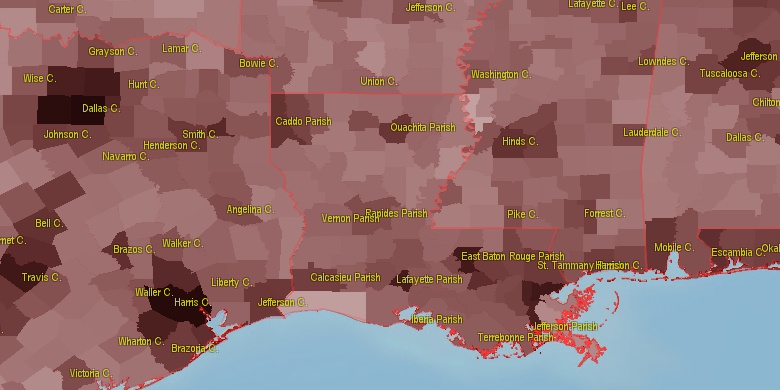
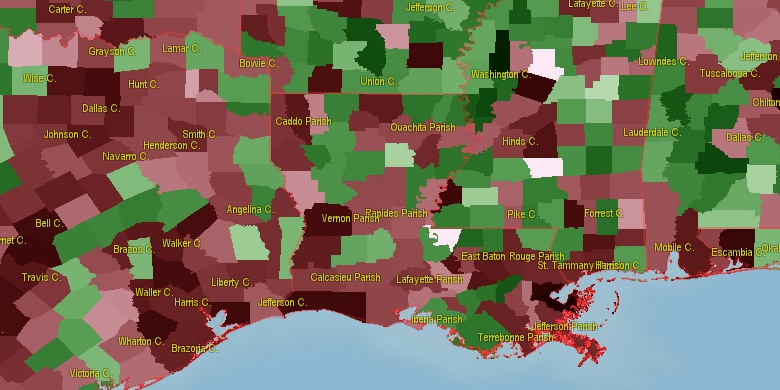
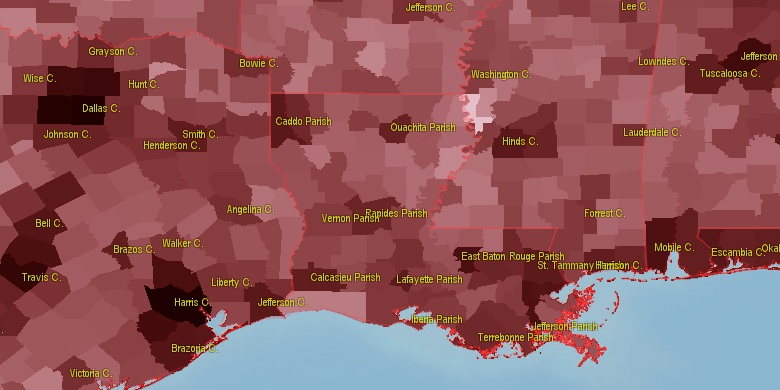
Estimated population for 2014[1]. Population density is in p./sq.mi [4]. Changes are for period 2010-2015. Value is %/year. Boundary lines are approx. 2012 [5]. Click on flag to hide it.
Population • Density • Changes • Legends • Position

[1850-1860] +6.33 %/yr
[1860-1870] -3.49 %/yr
[1870-1880] +7.14 %/yr
[1880-1890] +0.65 %/yr
[1890-1900] +4.59 %/yr
[1900-1910] +4.07 %/yr
[1910-1920] +1.18 %/yr
[1920-1930] +0.27 %/yr
[1930-1940] +0.9 %/yr
[1940-1950] -2.32 %/yr
[1950-1960] -0.43 %/yr
[1960-1970] +1.17 %/yr
[1970-1980] +1.29 %/yr
[1980-1990] +0.24 %/yr
[1990-2000] +1.04 %/yr
[2000-2005] -0.58 %/yr
[2005-2010] -0.25 %/yr
[2010-2014] -0.01 %/yr
Looking for settlements in Newton County? Visit this page: Settlements in Newton County, TX
Population of Newton County by age groups male (M) and female (F)[1b]
| Age Gr. | (M) | (F) | Total |
| 0 to 4 | 385 | 401 | 786 |
| 5 to 9 | 393 | 394 | 787 |
| 10 to 14 | 448 | 457 | 905 |
| 15 to 19 | 518 | 419 | 937 |
| 20 to 24 | 573 | 390 | 963 |
| 25 to 29 | 498 | 340 | 838 |
| 30 to 34 | 425 | 350 | 775 |
| 35 to 39 | 420 | 382 | 802 |
| 40 to 44 | 441 | 416 | 857 |
| 45 to 49 | 472 | 455 | 927 |
| 50 to 54 | 556 | 531 | 1,087 |
| 55 to 59 | 514 | 512 | 1,026 |
| 60 to 64 | 460 | 492 | 952 |
| 65 to 69 | 417 | 459 | 876 |
| 70 to 74 | 336 | 316 | 652 |
| 75 to 79 | 219 | 218 | 437 |
| 80 to 84 | 129 | 154 | 283 |
| 85+ | 89 | 159 | 248 |
Newton County resident population estimates by Sex, Race, and Hispanic Origin[1b]. For full list of abbrevations see: population.us/about page.
| Race | Male | Female | Total |
| NH | 7008 | 6626 | 13,634 |
| WAC | 5629 | 5455 | 11,084 |
| WA | 5533 | 5342 | 10,875 |
| NHWAC | 5360 | 5258 | 10,618 |
| NHWA | 5271 | 5159 | 10,430 |
| BAC | 1612 | 1331 | 2,943 |
| NHBAC | 1598 | 1307 | 2,905 |
| BA | 1557 | 1283 | 2,840 |
| NHBA | 1546 | 1264 | 2,810 |
| H | 285 | 219 | 504 |
| HWAC | 269 | 197 | 466 |
| HWA | 262 | 183 | 445 |
| TOM | 101 | 116 | 217 |
| IAC | 91 | 107 | 198 |
| NHTOM | 92 | 101 | 193 |
| NHIAC | 81 | 98 | 179 |
| AAC | 58 | 64 | 122 |
| NHAAC | 57 | 61 | 118 |
| IA | 53 | 58 | 111 |
| NHIA | 50 | 56 | 106 |
| AA | 47 | 46 | 93 |
| NHAA | 47 | 46 | 93 |
| HBAC | 14 | 24 | 38 |
| HBA | 11 | 19 | 30 |
| HTOM | 9 | 15 | 24 |
| HIAC | 10 | 9 | 19 |
| NAC | 5 | 7 | 12 |
| NHNAC | 5 | 6 | 11 |
| HIA | 3 | 2 | 5 |
| HAAC | 1 | 3 | 4 |
| NHNA | 2 | 0 | 2 |
| NA | 2 | 0 | 2 |
| HNAC | 0 | 1 | 1 |
| HNA | 0 | 0 | 0 |
| HAA | 0 | 0 | 0 |
• Calcasieu Parish population
44.7 mi,  149°
149°
• Orange County
46.8 mi,  191°
191°
• Hardin County
50.1 mi,  230°
230°
• Vernon Parish
39.9 mi,  55°
55°
• Beauregard Parish
25.6 mi,  112°
112°
• Jasper County
17 mi,  262°
262°
• Sabine Parish
54.5 mi,  11°
11°
• Tyler County
37.8 mi,  268°
268°
• Sabine County
39 mi,  350°
350°
• San Augustine County
48.2 mi,  328°
328°
[0] Calculated by population.us from last known population growth rate, not official data.
[1] County population - 2014, archived from the original, retrieved 02/23/2016
[1b] Annual County Resident Population Estimates by Age, Sex, Race, and Hispanic Origin, (used only data for 2014) archived from the original, retrieved 02/23/2016
[2] County population - 2000-2010, archived from the original, retrieved 02/23/2016
[3] Population of States and Counties of the United States: 1790 to 1992, PDF, 15 Mb, census.gov, retrieved 02/23/2016
[4] County area, latitude longitude data, retrieved 02/23/2016
[5] County boundaries, CSV files on boundaries.us, retrived 03/18/2016
Page generated in 0.019 seconds© 2016 population.us | Terms of use | Contact