Last official estimated population of Willacy County was 22,202 (year 2014)[1]. This was 0.007% of total US population and 0.1% of total Texas state population. Area of Willacy County is 784.3 mi² (=2031.2 km²), in this year population density was 28.31 p/mi². If population growth rate would be same as in period 2010-2014 (+0.08%/yr), Willacy County population in 2026 would be 22,407 [0].
Historical population of Willacy County for period 1930-2014 [1] , [2] , [3]:
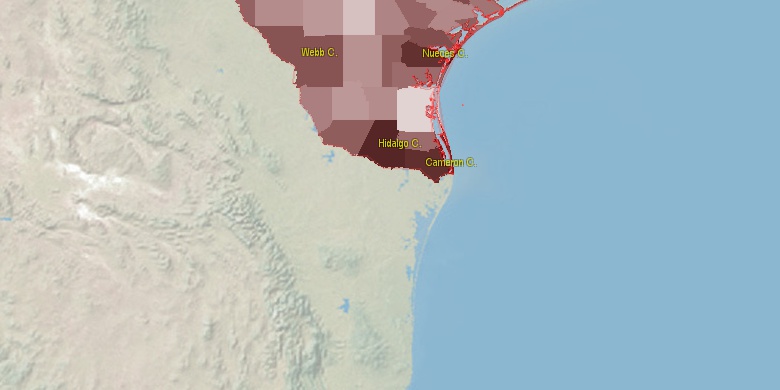
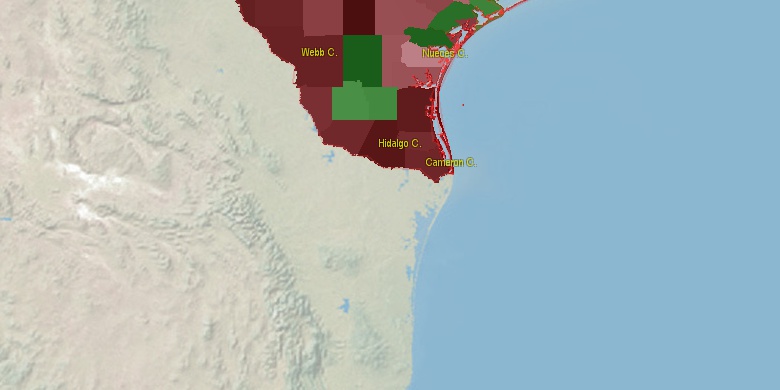
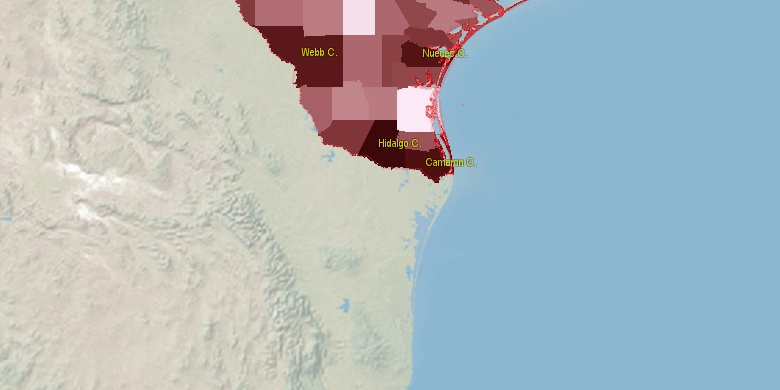
Estimated population for 2014[1]. Population density is in p./sq.mi [4]. Changes are for period 2010-2015. Value is %/year. Boundary lines are approx. 2012 [5]. Click on flag to hide it.
Population • Density • Changes • Legends • Position

[1930-1940] +2.34 %/yr
[1940-1950] +4.69 %/yr
[1950-1960] -0.41 %/yr
[1960-1970] -2.51 %/yr
[1970-1980] +1.17 %/yr
[1980-1990] +0.12 %/yr
[1990-2000] +1.27 %/yr
[2000-2005] +1.12 %/yr
[2005-2010] +0.84 %/yr
[2010-2014] +0.08 %/yr
Looking for settlements in Willacy County? Visit this page: Settlements in Willacy County, TX
Population of Willacy County by age groups male (M) and female (F)[1b]
| Age Gr. | (M) | (F) | Total |
| 0 to 4 | 741 | 691 | 1,432 |
| 5 to 9 | 786 | 783 | 1,569 |
| 10 to 14 | 821 | 764 | 1,585 |
| 15 to 19 | 963 | 774 | 1,737 |
| 20 to 24 | 1368 | 759 | 2,127 |
| 25 to 29 | 1170 | 636 | 1,806 |
| 30 to 34 | 993 | 574 | 1,567 |
| 35 to 39 | 917 | 595 | 1,512 |
| 40 to 44 | 738 | 573 | 1,311 |
| 45 to 49 | 640 | 554 | 1,194 |
| 50 to 54 | 600 | 585 | 1,185 |
| 55 to 59 | 528 | 569 | 1,097 |
| 60 to 64 | 467 | 558 | 1,025 |
| 65 to 69 | 421 | 439 | 860 |
| 70 to 74 | 317 | 387 | 704 |
| 75 to 79 | 219 | 237 | 456 |
| 80 to 84 | 143 | 238 | 381 |
| 85+ | 130 | 225 | 355 |
Willacy County resident population estimates by Sex, Race, and Hispanic Origin[1b]. For full list of abbrevations see: population.us/about page.
| Race | Male | Female | Total |
| WAC | 11310 | 9669 | 20,979 |
| WA | 11254 | 9612 | 20,866 |
| H | 10307 | 8894 | 19,201 |
| HWAC | 10146 | 8718 | 18,864 |
| HWA | 10123 | 8683 | 18,806 |
| NH | 1655 | 1047 | 2,702 |
| NHWAC | 1164 | 951 | 2,115 |
| NHWA | 1131 | 929 | 2,060 |
| BAC | 472 | 179 | 651 |
| BA | 438 | 150 | 588 |
| NHBAC | 376 | 66 | 442 |
| NHBA | 356 | 54 | 410 |
| HBAC | 96 | 113 | 209 |
| AAC | 140 | 50 | 190 |
| IAC | 89 | 97 | 186 |
| HBA | 82 | 96 | 178 |
| AA | 131 | 44 | 175 |
| NHAAC | 119 | 26 | 145 |
| IA | 74 | 69 | 143 |
| NHAA | 114 | 23 | 137 |
| HIAC | 60 | 69 | 129 |
| TOM | 59 | 60 | 119 |
| HIA | 54 | 54 | 108 |
| HTOM | 25 | 35 | 60 |
| NHTOM | 34 | 25 | 59 |
| NHIAC | 29 | 28 | 57 |
| HAAC | 21 | 24 | 45 |
| HAA | 17 | 21 | 38 |
| NHIA | 20 | 15 | 35 |
| NAC | 10 | 6 | 16 |
| HNAC | 9 | 5 | 14 |
| NA | 6 | 6 | 12 |
| HNA | 6 | 5 | 11 |
| NHNAC | 1 | 1 | 2 |
| NHNA | 0 | 1 | 1 |
• Hidalgo County population
37.4 mi,  261°
261°
• Cameron County
26.9 mi,  166°
166°
• Nueces County
87 mi,  2°
2°
• Starr County
71.6 mi,  272°
272°
• Jim Wells County
92 mi,  340°
340°
• Kleberg County
66.4 mi,  355°
355°
• Duval County
100.2 mi,  325°
325°
• Brooks County
54.7 mi,  314°
314°
• Jim Hogg County
79 mi,  299°
299°
• Kenedy County
28.3 mi, 359°
[0] Calculated by population.us from last known population growth rate, not official data.
[1] County population - 2014, archived from the original, retrieved 02/23/2016
[1b] Annual County Resident Population Estimates by Age, Sex, Race, and Hispanic Origin, (used only data for 2014) archived from the original, retrieved 02/23/2016
[2] County population - 2000-2010, archived from the original, retrieved 02/23/2016
[3] Population of States and Counties of the United States: 1790 to 1992, PDF, 15 Mb, census.gov, retrieved 02/23/2016
[4] County area, latitude longitude data, retrieved 02/23/2016
[5] County boundaries, CSV files on boundaries.us, retrived 03/18/2016
See note 6 Texas Notes
Page generated in 0.015 seconds© 2016 population.us | Terms of use | Contact