Last official estimated population of Daggett County was 1,067 (year 2014)[1]. This was 0% of total US population and 0% of total Utah state population. Area of Daggett County is 720.6 mi² (=1866.4 km²), in this year population density was 1.48 p/mi². If population growth rate would be same as in period 2010-2014 (+0.19%/yr), Daggett County population in 2026 would be 1,091 [0].
Historical population of Daggett County for period 1920-2014 [1] , [2] , [3]:
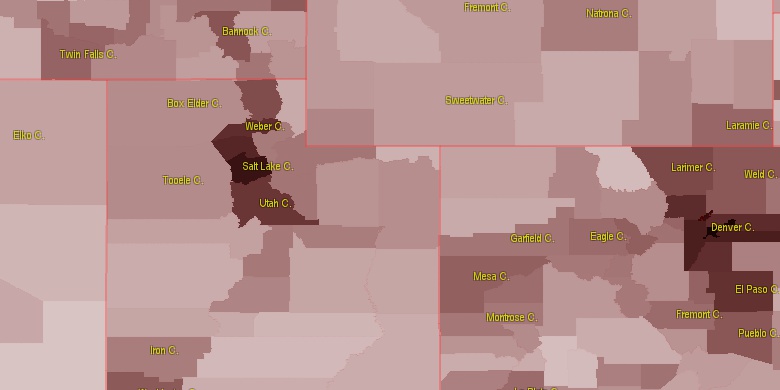
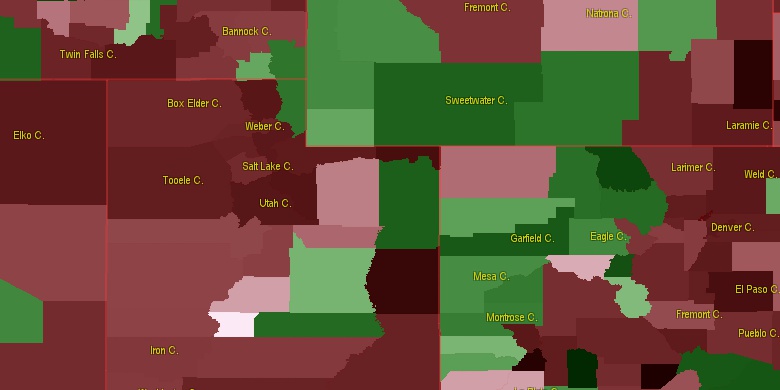
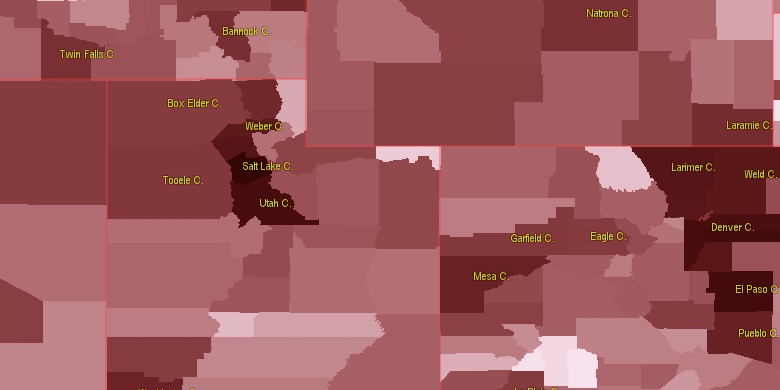
Estimated population for 2014[1]. Population density is in p./sq.mi [4]. Changes are for period 2010-2015. Value is %/year. Boundary lines are approx. 2012 [5]. Click on flag to hide it.
Population • Density • Changes • Legends • Position

[1920-1930] +0.27 %/yr
[1930-1940] +3.22 %/yr
[1940-1950] -4.28 %/yr
[1950-1960] +12.33 %/yr
[1960-1970] -5.43 %/yr
[1970-1980] +1.45 %/yr
[1980-1990] -1.08 %/yr
[1990-2000] +2.9 %/yr
[2000-2005] +1.05 %/yr
[2005-2010] +1.83 %/yr
[2010-2014] +0.19 %/yr
Looking for settlements in Daggett County? Visit this page: Settlements in Daggett County, UT
Population of Daggett County by age groups male (M) and female (F)[1b]
| Age Gr. | (M) | (F) | Total |
| 0 to 4 | 32 | 26 | 58 |
| 5 to 9 | 45 | 34 | 79 |
| 10 to 14 | 45 | 38 | 83 |
| 15 to 19 | 31 | 28 | 59 |
| 20 to 24 | 28 | 16 | 44 |
| 25 to 29 | 38 | 23 | 61 |
| 30 to 34 | 47 | 33 | 80 |
| 35 to 39 | 35 | 30 | 65 |
| 40 to 44 | 34 | 26 | 60 |
| 45 to 49 | 27 | 20 | 47 |
| 50 to 54 | 37 | 46 | 83 |
| 55 to 59 | 42 | 29 | 71 |
| 60 to 64 | 50 | 40 | 90 |
| 65 to 69 | 41 | 49 | 90 |
| 70 to 74 | 39 | 20 | 59 |
| 75 to 79 | 20 | 18 | 38 |
| 80 to 84 | 20 | 9 | 29 |
| 85+ | 13 | 8 | 21 |
Daggett County resident population estimates by Sex, Race, and Hispanic Origin[1b]. For full list of abbrevations see: population.us/about page.
| Race | Male | Female | Total |
| WAC | 606 | 481 | 1,087 |
| WA | 598 | 474 | 1,072 |
| NH | 591 | 479 | 1,070 |
| NHWAC | 579 | 470 | 1,049 |
| NHWA | 574 | 465 | 1,039 |
| H | 33 | 14 | 47 |
| HWAC | 27 | 11 | 38 |
| HWA | 24 | 9 | 33 |
| IAC | 10 | 10 | 20 |
| TOM | 9 | 9 | 18 |
| IA | 9 | 7 | 16 |
| BAC | 8 | 7 | 15 |
| NHBAC | 8 | 5 | 13 |
| NHTOM | 6 | 6 | 12 |
| NHIAC | 4 | 7 | 11 |
| AAC | 7 | 3 | 10 |
| HIAC | 6 | 3 | 9 |
| NHIA | 4 | 5 | 9 |
| HIA | 5 | 2 | 7 |
| NHAAC | 5 | 2 | 7 |
| AA | 4 | 2 | 6 |
| HTOM | 3 | 3 | 6 |
| NHAA | 3 | 2 | 5 |
| NHBA | 4 | 0 | 4 |
| BA | 4 | 0 | 4 |
| HAAC | 2 | 1 | 3 |
| NAC | 2 | 1 | 3 |
| NHNAC | 1 | 1 | 2 |
| HBAC | 0 | 2 | 2 |
| HNAC | 1 | 0 | 1 |
| HAA | 1 | 0 | 1 |
| NA | 0 | 1 | 1 |
| NHNA | 0 | 1 | 1 |
| HBA | 0 | 0 | 0 |
| HNA | 0 | 0 | 0 |
• Sweetwater County population
62.5 mi,  31°
31°
• Summit County
76.4 mi,  269°
269°
• Uintah County
52.8 mi,  180°
180°
• Wasatch County
94.9 mi,  246°
246°
• Carbon County
101.6 mi,  214°
214°
• Uinta County
61.2 mi,  296°
296°
• Duchesne County
63.8 mi,  229°
229°
• Moffat County
70.3 mi,  105°
105°
• Rio Blanco County
93.4 mi,  132°
132°
• Rich County
103.5 mi, 299°
[0] Calculated by population.us from last known population growth rate, not official data.
[1] County population - 2014, archived from the original, retrieved 02/23/2016
[1b] Annual County Resident Population Estimates by Age, Sex, Race, and Hispanic Origin, (used only data for 2014) archived from the original, retrieved 02/23/2016
[2] County population - 2000-2010, archived from the original, retrieved 02/23/2016
[3] Population of States and Counties of the United States: 1790 to 1992, PDF, 15 Mb, census.gov, retrieved 02/23/2016
[4] County area, latitude longitude data, retrieved 02/23/2016
[5] County boundaries, CSV files on boundaries.us, retrived 03/18/2016
*Uintah Utah Notes
Page generated in 0.036 seconds© 2016 population.us | Terms of use | Contact