Last official estimated population of Millard County was 12,523 (year 2014)[1]. This was 0.004% of total US population and 0.4% of total Utah state population. Area of Millard County is 6,836.9 mi² (=17707.6 km²), in this year population density was 1.83 p/mi². If population growth rate would be same as in period 2010-2014 (+0.04%/yr), Millard County population in 2026 would be 12,583 [0].
Historical population of Millard County for period 1860-2014 [1] , [2] , [3]:
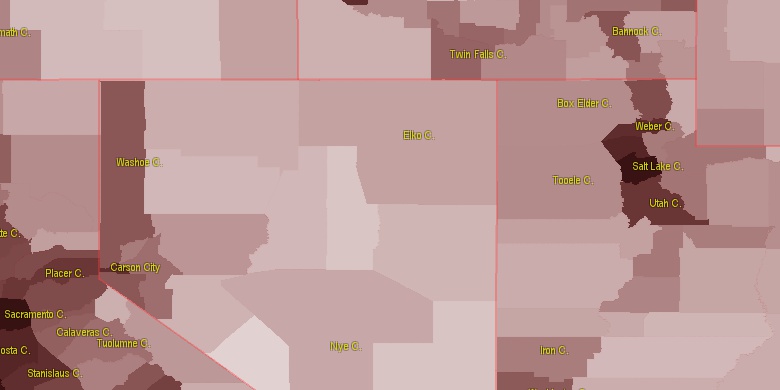
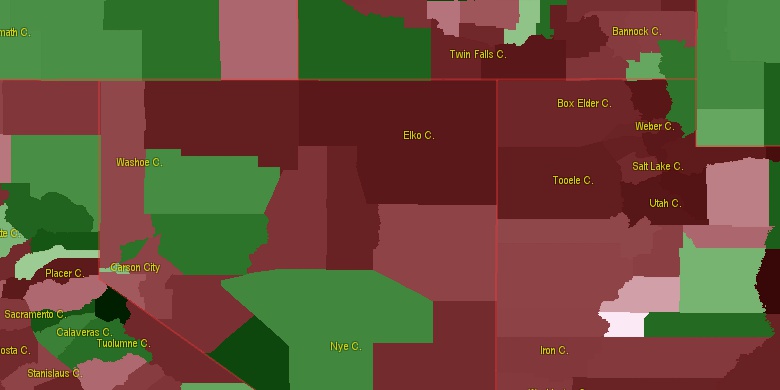
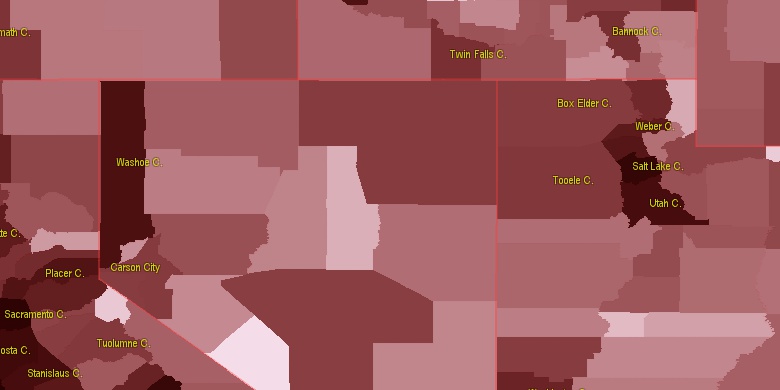
Estimated population for 2014[1]. Population density is in p./sq.mi [4]. Changes are for period 2010-2015. Value is %/year. Boundary lines are approx. 2012 [5]. Click on flag to hide it.
Population • Density • Changes • Legends • Position

[1860-1870] +14.43 %/yr
[1870-1880] +3.08 %/yr
[1880-1890] +0.79 %/yr
[1890-1900] +3.48 %/yr
[1900-1910] +0.75 %/yr
[1910-1920] +4.67 %/yr
[1920-1930] +0.29 %/yr
[1930-1940] -0.34 %/yr
[1940-1950] -0.24 %/yr
[1950-1960] -1.75 %/yr
[1960-1970] -1.18 %/yr
[1970-1980] +2.53 %/yr
[1980-1990] +2.37 %/yr
[1990-2000] +0.91 %/yr
[2000-2005] -0.77 %/yr
[2005-2010] +0.93 %/yr
[2010-2014] +0.04 %/yr
Looking for settlements in Millard County? Visit this page: Settlements in Millard County, UT
Population of Millard County by age groups male (M) and female (F)[1b]
| Age Gr. | (M) | (F) | Total |
| 0 to 4 | 544 | 490 | 1,034 |
| 5 to 9 | 569 | 567 | 1,136 |
| 10 to 14 | 550 | 539 | 1,089 |
| 15 to 19 | 565 | 493 | 1,058 |
| 20 to 24 | 362 | 322 | 684 |
| 25 to 29 | 297 | 303 | 600 |
| 30 to 34 | 412 | 342 | 754 |
| 35 to 39 | 372 | 351 | 723 |
| 40 to 44 | 329 | 301 | 630 |
| 45 to 49 | 294 | 300 | 594 |
| 50 to 54 | 347 | 388 | 735 |
| 55 to 59 | 416 | 402 | 818 |
| 60 to 64 | 365 | 358 | 723 |
| 65 to 69 | 327 | 294 | 621 |
| 70 to 74 | 269 | 261 | 530 |
| 75 to 79 | 168 | 167 | 335 |
| 80 to 84 | 108 | 152 | 260 |
| 85+ | 131 | 151 | 282 |
Millard County resident population estimates by Sex, Race, and Hispanic Origin[1b]. For full list of abbrevations see: population.us/about page.
| Race | Male | Female | Total |
| WAC | 6174 | 5972 | 12,146 |
| WA | 6094 | 5881 | 11,975 |
| NH | 5529 | 5468 | 10,997 |
| NHWAC | 5381 | 5345 | 10,726 |
| NHWA | 5326 | 5278 | 10,604 |
| H | 896 | 713 | 1,609 |
| HWAC | 793 | 627 | 1,420 |
| HWA | 768 | 603 | 1,371 |
| IAC | 167 | 172 | 339 |
| IA | 126 | 120 | 246 |
| TOM | 84 | 97 | 181 |
| NHIAC | 80 | 95 | 175 |
| HIAC | 87 | 77 | 164 |
| AAC | 75 | 66 | 141 |
| HIA | 73 | 62 | 135 |
| NHTOM | 59 | 73 | 132 |
| BAC | 69 | 49 | 118 |
| NHAAC | 65 | 53 | 118 |
| NHIA | 53 | 58 | 111 |
| AA | 60 | 50 | 110 |
| NHAA | 53 | 40 | 93 |
| NHBAC | 41 | 29 | 70 |
| BA | 44 | 21 | 65 |
| HTOM | 25 | 24 | 49 |
| HBAC | 28 | 20 | 48 |
| NAC | 26 | 21 | 47 |
| NHNAC | 23 | 21 | 44 |
| HBA | 21 | 14 | 35 |
| NHBA | 23 | 7 | 30 |
| NA | 17 | 12 | 29 |
| NHNA | 15 | 12 | 27 |
| HAAC | 10 | 13 | 23 |
| HAA | 7 | 10 | 17 |
| HNAC | 3 | 0 | 3 |
| HNA | 2 | 0 | 2 |
• Utah County population
121.6 mi,  54°
54°
• Tooele County
97.2 mi,  12°
12°
• Iron County
82.7 mi,  171°
171°
• Sanpete County
106.3 mi,  79°
79°
• Sevier County
95.2 mi,  104°
104°
• Juab County
58.1 mi,  42°
42°
• White Pine County
76.9 mi,  286°
286°
• Beaver County
53.2 mi,  163°
163°
• Lincoln County
124.2 mi,  215°
215°
• Piute County
91.7 mi,  124°
124°
[0] Calculated by population.us from last known population growth rate, not official data.
[1] County population - 2014, archived from the original, retrieved 02/23/2016
[1b] Annual County Resident Population Estimates by Age, Sex, Race, and Hispanic Origin, (used only data for 2014) archived from the original, retrieved 02/23/2016
[2] County population - 2000-2010, archived from the original, retrieved 02/23/2016
[3] Population of States and Counties of the United States: 1790 to 1992, PDF, 15 Mb, census.gov, retrieved 02/23/2016
[4] County area, latitude longitude data, retrieved 02/23/2016
[5] County boundaries, CSV files on boundaries.us, retrived 03/18/2016
Page generated in 0.019 seconds© 2016 population.us | Terms of use | Contact