Last official estimated population of Covington city was 5,955 (year 2014)[1]. This was 0.002% of total US population and 0.1% of total Virginia state population. Area of Covington city is 5.7 mi² (=14.7 km²), in this year population density was 1,050.26 p/mi². If population growth rate would be same as in period 2010-2014 (-0.03%/yr), Covington city population in 2026 would be 5,937 [0].
Historical population of Covington city for period 1960-2014 [1] , [2] , [3]:
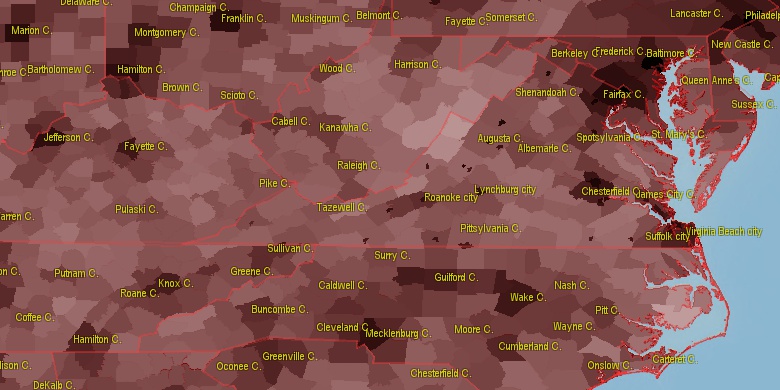
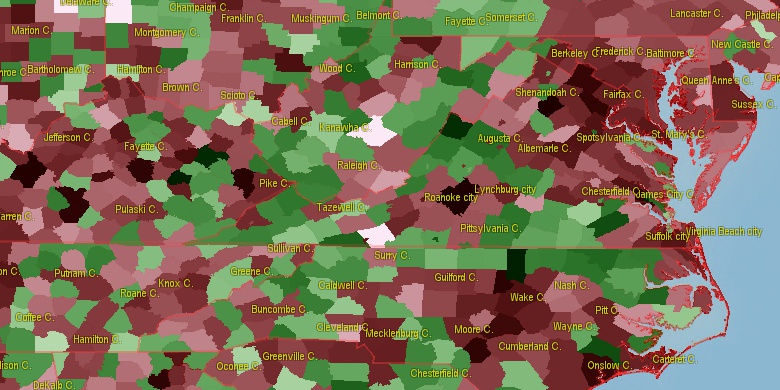
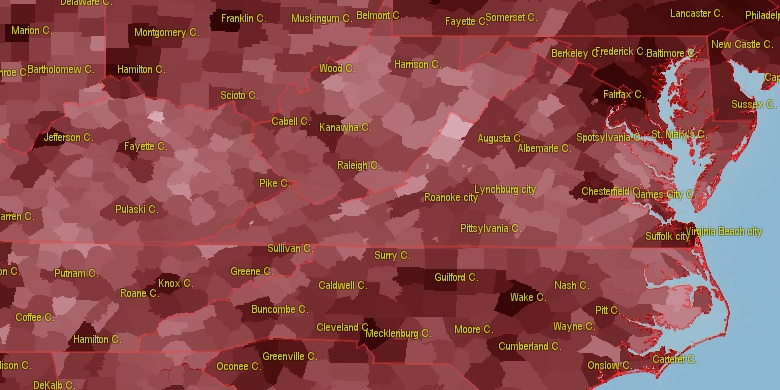
Estimated population for 2014[1]. Population density is in p./sq.mi [4]. Changes are for period 2010-2015. Value is %/year. Boundary lines are approx. 2012 [5]. Click on flag to hide it.
Population • Density • Changes • Legends • Position

[1960-1970] -0.94 %/yr
[1970-1980] -1.04 %/yr
[1980-1990] -2.07 %/yr
[1990-2000] -1.54 %/yr
[2000-2005] -0.71 %/yr
[2005-2010] -0.37 %/yr
[2010-2014] -0.03 %/yr
Looking for settlements in Covington city? Visit this page: Settlements in Covington city, VA
Population of Covington city by age groups male (M) and female (F)[1b]
| Age Gr. | (M) | (F) | Total |
| 0 to 4 | 204 | 206 | 410 |
| 5 to 9 | 173 | 167 | 340 |
| 10 to 14 | 179 | 187 | 366 |
| 15 to 19 | 168 | 147 | 315 |
| 20 to 24 | 180 | 174 | 354 |
| 25 to 29 | 187 | 162 | 349 |
| 30 to 34 | 156 | 159 | 315 |
| 35 to 39 | 166 | 143 | 309 |
| 40 to 44 | 173 | 178 | 351 |
| 45 to 49 | 185 | 195 | 380 |
| 50 to 54 | 240 | 216 | 456 |
| 55 to 59 | 217 | 212 | 429 |
| 60 to 64 | 164 | 165 | 329 |
| 65 to 69 | 170 | 200 | 370 |
| 70 to 74 | 121 | 144 | 265 |
| 75 to 79 | 76 | 107 | 183 |
| 80 to 84 | 47 | 79 | 126 |
| 85+ | 58 | 97 | 155 |
Covington city resident population estimates by Sex, Race, and Hispanic Origin[1b]. For full list of abbrevations see: population.us/about page.
| Race | Male | Female | Total |
| NH | 2774 | 2883 | 5,657 |
| WAC | 2448 | 2540 | 4,988 |
| NHWAC | 2368 | 2490 | 4,858 |
| WA | 2381 | 2473 | 4,854 |
| NHWA | 2303 | 2423 | 4,726 |
| BAC | 430 | 400 | 830 |
| NHBAC | 423 | 397 | 820 |
| BA | 384 | 357 | 741 |
| NHBA | 377 | 354 | 731 |
| H | 90 | 55 | 145 |
| TOM | 68 | 69 | 137 |
| NHTOM | 66 | 69 | 135 |
| HWAC | 80 | 50 | 130 |
| HWA | 78 | 50 | 128 |
| AAC | 28 | 36 | 64 |
| NHAAC | 26 | 36 | 62 |
| IAC | 25 | 32 | 57 |
| NHIAC | 22 | 30 | 52 |
| AA | 22 | 24 | 46 |
| NHAA | 21 | 24 | 45 |
| IA | 9 | 15 | 24 |
| NHIA | 7 | 13 | 20 |
| HBAC | 7 | 3 | 10 |
| HBA | 7 | 3 | 10 |
| HIAC | 3 | 2 | 5 |
| HIA | 2 | 2 | 4 |
| HTOM | 2 | 0 | 2 |
| HAAC | 2 | 0 | 2 |
| NAC | 1 | 0 | 1 |
| NHNAC | 1 | 0 | 1 |
| HAA | 1 | 0 | 1 |
| HNAC | 0 | 0 | 0 |
| HNA | 0 | 0 | 0 |
| NA | 0 | 0 | 0 |
| NHNA | 0 | 0 | 0 |
• Roanoke County population
32.9 mi,  199°
199°
• Greenbrier County
27.3 mi,  291°
291°
• Botetourt County
17.9 mi,  144°
144°
• Salem city
34.3 mi,  186°
186°
• Rockbridge County
29.5 mi,  85°
85°
• Alleghany County
1.4 mi,  298°
298°
• Lexington city
29.6 mi, 89°
• Buena Vista city
34.5 mi,  95°
95°
• Craig County
24.9 mi,  212°
212°
• Bath County
24.4 mi,  34°
34°
[0] Calculated by population.us from last known population growth rate, not official data.
[1] County population - 2014, archived from the original, retrieved 02/23/2016
[1b] Annual County Resident Population Estimates by Age, Sex, Race, and Hispanic Origin, (used only data for 2014) archived from the original, retrieved 02/23/2016
[2] County population - 2000-2010, archived from the original, retrieved 02/23/2016
[3] Population of States and Counties of the United States: 1790 to 1992, PDF, 15 Mb, census.gov, retrieved 02/23/2016
[4] County area, latitude longitude data, retrieved 02/23/2016
[5] County boundaries, CSV files on boundaries.us, retrived 03/18/2016
See note C9 Virginia Notes
Page generated in 0.022 seconds© 2016 population.us | Terms of use | Contact