Last official estimated population of James City County was 67,751 (year 2014)[1]. This was 0.021% of total US population and 0.8% of total Virginia state population. Area of James City County is 179.3 mi² (=464.3 km²), in this year population density was 377.96 p/mi². If population growth rate would be same as in period 2010-2014 (+0.28%/yr), James City County population in 2026 would be 70,027 [0].
Historical population of James City County for period 1790-2014 [1] , [2] , [3]:
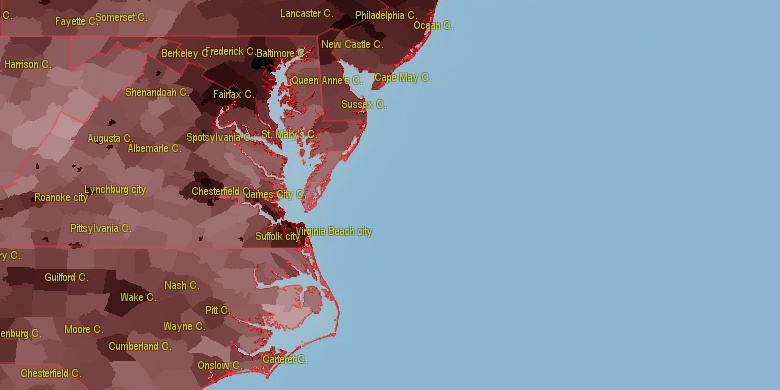
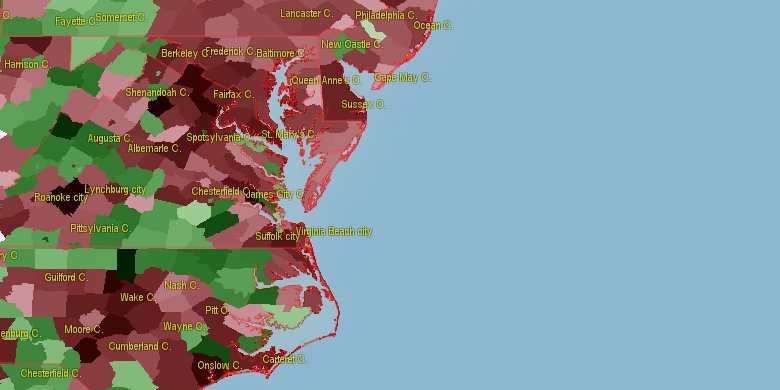
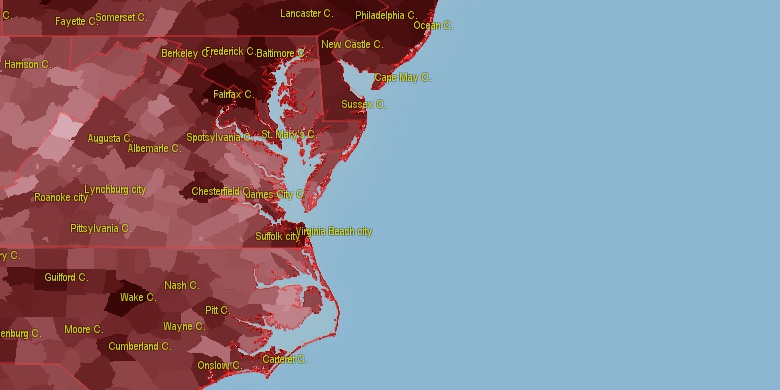
Estimated population for 2014[1]. Population density is in p./sq.mi [4]. Changes are for period 2010-2015. Value is %/year. Boundary lines are approx. 2012 [5]. Click on flag to hide it.
Population • Density • Changes • Legends • Position

[1790-1800] -0.35 %/yr
[1800-1810] +0.41 %/yr
[1810-1820] +1.09 %/yr
[1820-1830] -1.72 %/yr
[1830-1840] -0.15 %/yr
[1840-1850] +0.62 %/yr
[1850-1860] +3.73 %/yr
[1860-1870] -2.67 %/yr
[1870-1880] +2.05 %/yr
[1880-1890] +0.4 %/yr
[1890-1900] -4.16 %/yr
[1900-1910] -0.17 %/yr
[1910-1920] +0.14 %/yr
[1920-1930] +0.54 %/yr
[1930-1940] +2.38 %/yr
[1940-1950] +2.56 %/yr
[1950-1960] +6.21 %/yr
[1960-1970] +4.46 %/yr
[1970-1980] +2.46 %/yr
[1980-1990] +4.33 %/yr
[1990-2000] +3.29 %/yr
[2000-2005] +3.97 %/yr
[2005-2010] +2.78 %/yr
[2010-2014] +0.28 %/yr
Looking for settlements in James City County? Visit this page: Settlements in James City County, VA
Population of James City County by age groups male (M) and female (F)[1b]
| Age Gr. | (M) | (F) | Total |
| 0 to 4 | 1847 | 1823 | 3,670 |
| 5 to 9 | 2072 | 2047 | 4,119 |
| 10 to 14 | 2259 | 2255 | 4,514 |
| 15 to 19 | 2306 | 2090 | 4,396 |
| 20 to 24 | 2040 | 1942 | 3,982 |
| 25 to 29 | 1909 | 1865 | 3,774 |
| 30 to 34 | 1849 | 1904 | 3,753 |
| 35 to 39 | 1849 | 1906 | 3,755 |
| 40 to 44 | 2015 | 2171 | 4,186 |
| 45 to 49 | 2271 | 2481 | 4,752 |
| 50 to 54 | 2442 | 2724 | 5,166 |
| 55 to 59 | 2323 | 2619 | 4,942 |
| 60 to 64 | 2279 | 2732 | 5,011 |
| 65 to 69 | 2363 | 2770 | 5,133 |
| 70 to 74 | 1967 | 2299 | 4,266 |
| 75 to 79 | 1490 | 1486 | 2,976 |
| 80 to 84 | 981 | 1132 | 2,113 |
| 85+ | 780 | 1295 | 2,075 |
James City County resident population estimates by Sex, Race, and Hispanic Origin[1b]. For full list of abbrevations see: population.us/about page.
| Race | Male | Female | Total |
| NH | 33053 | 35537 | 68,590 |
| WAC | 29139 | 31107 | 60,246 |
| WA | 28277 | 30250 | 58,527 |
| NHWAC | 27380 | 29350 | 56,730 |
| NHWA | 26607 | 28587 | 55,194 |
| BAC | 5239 | 5630 | 10,869 |
| NHBAC | 5038 | 5393 | 10,431 |
| BA | 4758 | 5122 | 9,880 |
| NHBA | 4609 | 4951 | 9,560 |
| H | 1989 | 2004 | 3,993 |
| HWAC | 1759 | 1757 | 3,516 |
| HWA | 1670 | 1663 | 3,333 |
| AAC | 1251 | 1374 | 2,625 |
| NHAAC | 1198 | 1323 | 2,521 |
| TOM | 983 | 985 | 1,968 |
| AA | 862 | 1016 | 1,878 |
| NHAA | 833 | 990 | 1,823 |
| NHTOM | 879 | 874 | 1,753 |
| IAC | 380 | 400 | 780 |
| NHIAC | 303 | 324 | 627 |
| HBAC | 201 | 237 | 438 |
| HBA | 149 | 171 | 320 |
| IA | 134 | 124 | 258 |
| HTOM | 104 | 111 | 215 |
| NHIA | 103 | 92 | 195 |
| NAC | 86 | 100 | 186 |
| NHNAC | 76 | 91 | 167 |
| HIAC | 77 | 76 | 153 |
| HAAC | 53 | 51 | 104 |
| NA | 28 | 44 | 72 |
| NHNA | 22 | 43 | 65 |
| HIA | 31 | 32 | 63 |
| HAA | 29 | 26 | 55 |
| HNAC | 10 | 9 | 19 |
| HNA | 6 | 1 | 7 |
• Newport News city population
22.2 mi,  140°
140°
• York County
22.2 mi,  108°
108°
• Gloucester County
15 mi,  68°
68°
• Prince George County
26.2 mi,  248°
248°
• New Kent County
16.7 mi,  317°
317°
• Williamsburg city
5.4 mi,  134°
134°
• Middlesex County
23.8 mi,  35°
35°
• Charles City County
15.4 mi,  279°
279°
• Surry County
15.2 mi,  201°
201°
• King and Queen County
27.8 mi,  345°
345°
[0] Calculated by population.us from last known population growth rate, not official data.
[1] County population - 2014, archived from the original, retrieved 02/23/2016
[1b] Annual County Resident Population Estimates by Age, Sex, Race, and Hispanic Origin, (used only data for 2014) archived from the original, retrieved 02/23/2016
[2] County population - 2000-2010, archived from the original, retrieved 02/23/2016
[3] Population of States and Counties of the United States: 1790 to 1992, PDF, 15 Mb, census.gov, retrieved 02/23/2016
[4] County area, latitude longitude data, retrieved 02/23/2016
[5] County boundaries, CSV files on boundaries.us, retrived 03/18/2016
See note C41 Virginia Notes
Page generated in 0.012 seconds© 2016 population.us | Terms of use | Contact