Last official estimated population of Lynnville city (Jasper County**, Iowa state) was 391 (year 2014)[1]. This was 0% of total US population and 0.01% of total Iowa state population. Area of Lynnville city is 1.1 mi² (=2.9 km²)[6], in this year population density was 353.85 p/mi². If population growth rate would be same as in period 2010-2014 (+0.78%/yr), Lynnville city population in 2026 would be 429*.
Historical population of Lynnville city for period 1880-2014:
Estimated population for 2014[1]. Click on flag to hide it.
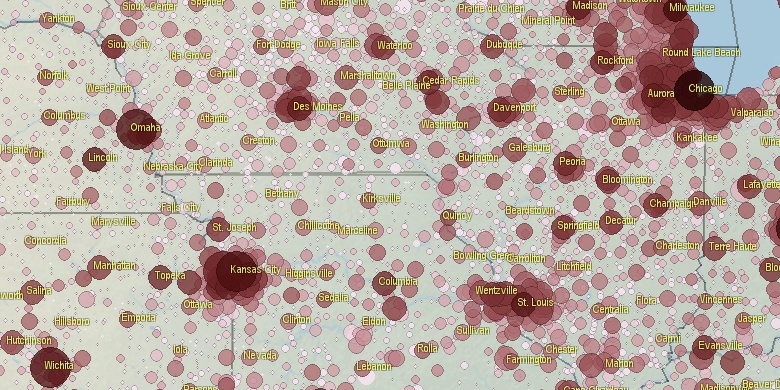
Population • Legends • Position

[1880-1890] -1.25 %/yr
[1890-1900] +2.89 %/yr
[1900-1910] +0.64 %/yr
[1910-1920] +2.22 %/yr
[1920-1930] -0.79 %/yr
[1930-1940] +0.02 %/yr
[1940-1950] -0.5 %/yr
[1950-1960] +0.12 %/yr
[1960-1970] -0.76 %/yr
[1970-1980] +0.64 %/yr
[1980-1990] -0.32 %/yr
[1990-2000] -0.34 %/yr
[2000-2005] +0.16 %/yr
[2005-2010] -0.21 %/yr
[2010-2014] +0.78 %/yr
• Pella city population
13.4 mi,  210°
210°
• Grinnell city
11.8 mi,  15°
15°
• Montezuma city
13.4 mi,  87°
87°
• New Sharon city
10 mi,  135°
135°
• Sully city
3.1 mi,  276°
276°
• Kellogg city
11.8 mi,  328°
328°
• Malcom city
15.1 mi,  51°
51°
• Oakland Acres city
10.4 mi,  350°
350°
• Reasnor city
12.2 mi,  271°
271°
• Searsboro city
4.3 mi,  84°
84°
*Calculated by population.us from last known population growth rate, not official data.
**Some cities are placed on more than one county. Only 1 county is shown.
[1] Cities and Towns (Incorporated Places and Minor Civil Divisions) 2014, archived from the original, retrieved 02/23/2016
[2] City and Town Intercensal Estimates (2000-2010), archived from the original, retrieved 02/23/2016
[3] Places: 1990 and 1999 Populations, With Numeric and Percent Population Change, archived from the original, retrieved 02/23/2016
[4] Population of the 100 Largest Urban Places: 1980,
[5] Population of the 100 Largest Urban Places in history,
[6] Area, latitude longitude data, retrieved 02/23/2016
[7] Through the Decades, Overview 1790-2010, PDF, large files! >100 Mb
Page generated in 0.033 seconds© 2016 population.us | Terms of use | Contact