Last official estimated population of Maryville village (Madison County**, Illinois state) was 7,826 (year 2014)[1]. This was 0.002% of total US population and 0.06% of total Illinois state population. Area of Maryville village is 5.4 mi² (=14 km²)[6], in this year population density was 1,444.71 p/mi². If population growth rate would be same as in period 2010-2014 (+1.11%/yr), Maryville village population in 2026 would be 8,938*.
Historical population of Maryville village for period 1910-2014:
Estimated population for 2014[1]. Click on flag to hide it.
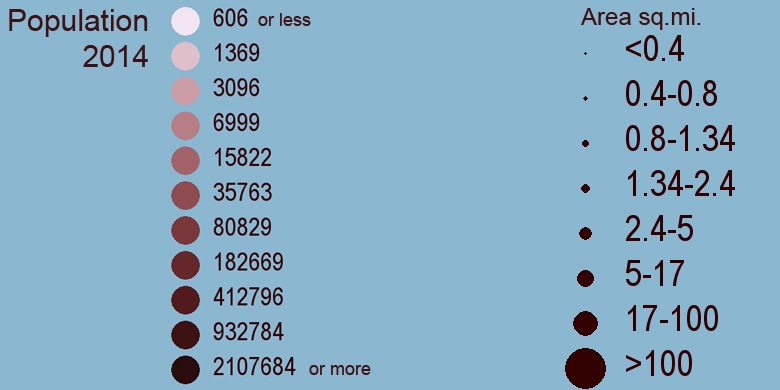
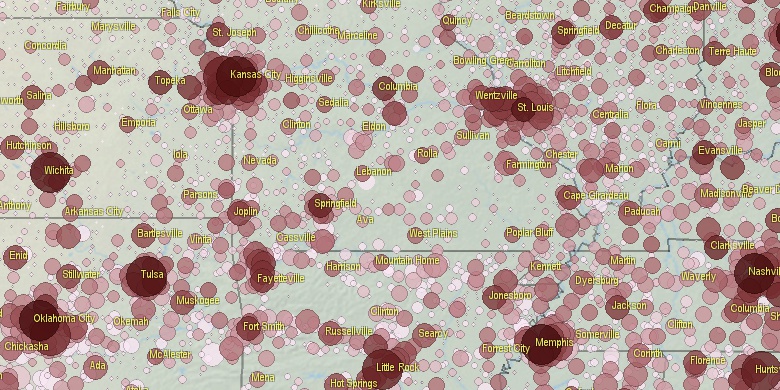
Population • Legends • Position

[1910-1920] +1.38 %/yr
[1920-1930] -3.23 %/yr
[1930-1940] -1.15 %/yr
[1940-1950] +0.06 %/yr
[1950-1960] +2.28 %/yr
[1960-1970] +4.69 %/yr
[1970-1980] +6.21 %/yr
[1980-1990] +3.91 %/yr
[1990-2000] +5.51 %/yr
[2000-2005] +5.07 %/yr
[2005-2010] +3.65 %/yr
[2010-2014] +1.11 %/yr
• Granite City city population
8.6 mi,  270°
270°
• Collinsville city
4.2 mi,  210°
210°
• Edwardsville city
4.5 mi,  344°
344°
• Glen Carbon village
2.2 mi, 335°
• Troy city
4 mi,  88°
88°
• Pontoon Beach village
6.7 mi,  258°
258°
• Caseyville village
7.7 mi, 208°
• Madison city
8.5 mi,  244°
244°
• South Roxana village
8.3 mi,  320°
320°
• Roxana village
7.7 mi,  326°
326°
*Calculated by population.us from last known population growth rate, not official data.
**Some cities are placed on more than one county. Only 1 county is shown.
[1] Cities and Towns (Incorporated Places and Minor Civil Divisions) 2014, archived from the original, retrieved 02/23/2016
[2] City and Town Intercensal Estimates (2000-2010), archived from the original, retrieved 02/23/2016
[3] Places: 1990 and 1999 Populations, With Numeric and Percent Population Change, archived from the original, retrieved 02/23/2016
[4] Population of the 100 Largest Urban Places: 1980,
[5] Population of the 100 Largest Urban Places in history,
[6] Area, latitude longitude data, retrieved 02/23/2016
[7] Through the Decades, Overview 1790-2010, PDF, large files! >100 Mb
Page generated in 0.009 seconds© 2016 population.us | Terms of use | Contact