Last official estimated population of Lake County was 28,785 (year 2014)[1]. This was 0.009% of total US population and 2.8% of total Montana state population. Area of Lake County is 1,654.0 mi² (=4283.8 km²), in this year population density was 17.40 p/mi². If population growth rate would be same as in period 2010-2014 (+0.03%/yr), Lake County population in 2026 would be 28,902 [0].
Historical population of Lake County for period 1930-2014 [1] , [2] , [3]:
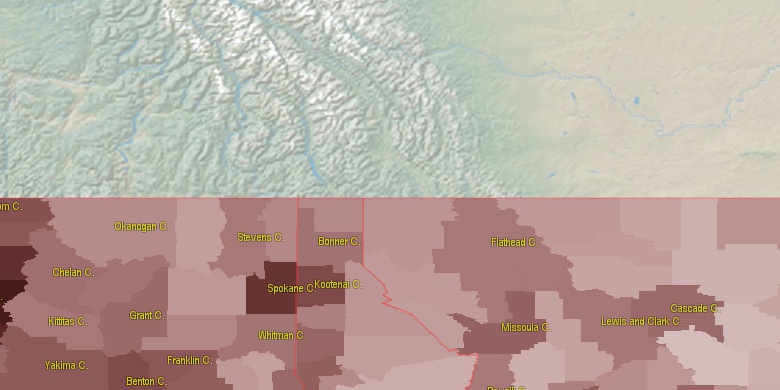
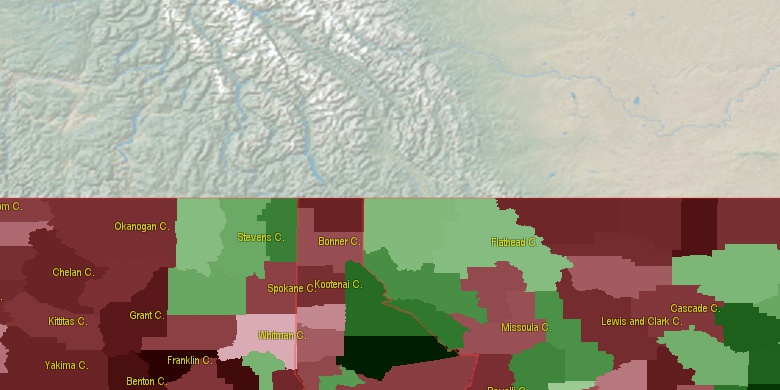
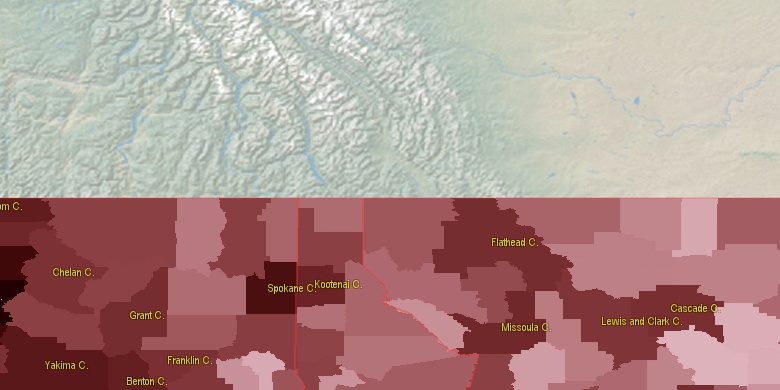
Estimated population for 2014[1]. Population density is in p./sq.mi [4]. Changes are for period 2010-2015. Value is %/year. Boundary lines are approx. 2012 [5]. Click on flag to hide it.
Population • Density • Changes • Legends • Position

[1930-1940] +3.52 %/yr
[1940-1950] +0.25 %/yr
[1950-1960] -0.54 %/yr
[1960-1970] +0.98 %/yr
[1970-1980] +2.81 %/yr
[1980-1990] +1 %/yr
[1990-2000] +2.33 %/yr
[2000-2005] +1.14 %/yr
[2005-2010] +0.51 %/yr
[2010-2014] +0.03 %/yr
Looking for settlements in Lake County? Visit this page: Settlements in Lake County, MT
Population of Lake County by age groups male (M) and female (F)[1b]
| Age Gr. | (M) | (F) | Total |
| 0 to 4 | 947 | 917 | 1,864 |
| 5 to 9 | 1021 | 987 | 2,008 |
| 10 to 14 | 1009 | 943 | 1,952 |
| 15 to 19 | 1022 | 936 | 1,958 |
| 20 to 24 | 821 | 769 | 1,590 |
| 25 to 29 | 724 | 769 | 1,493 |
| 30 to 34 | 718 | 742 | 1,460 |
| 35 to 39 | 720 | 782 | 1,502 |
| 40 to 44 | 679 | 759 | 1,438 |
| 45 to 49 | 739 | 852 | 1,591 |
| 50 to 54 | 973 | 1026 | 1,999 |
| 55 to 59 | 1037 | 1237 | 2,274 |
| 60 to 64 | 1100 | 1147 | 2,247 |
| 65 to 69 | 952 | 955 | 1,907 |
| 70 to 74 | 823 | 720 | 1,543 |
| 75 to 79 | 452 | 518 | 970 |
| 80 to 84 | 340 | 345 | 685 |
| 85+ | 229 | 389 | 618 |
Lake County resident population estimates by Sex, Race, and Hispanic Origin[1b]. For full list of abbrevations see: population.us/about page.
| Race | Male | Female | Total |
| NH | 13727 | 14189 | 27,916 |
| WAC | 10784 | 11107 | 21,891 |
| NHWAC | 10410 | 10758 | 21,168 |
| WA | 9788 | 10053 | 19,841 |
| NHWA | 9492 | 9777 | 19,269 |
| IAC | 4269 | 4497 | 8,766 |
| NHIAC | 4013 | 4192 | 8,205 |
| IA | 3341 | 3516 | 6,857 |
| NHIA | 3150 | 3276 | 6,426 |
| TOM | 1016 | 1068 | 2,084 |
| NHTOM | 935 | 992 | 1,927 |
| H | 579 | 604 | 1,183 |
| HWAC | 374 | 349 | 723 |
| HWA | 296 | 276 | 572 |
| HIAC | 256 | 305 | 561 |
| HIA | 191 | 240 | 431 |
| AAC | 116 | 153 | 269 |
| NHAAC | 104 | 141 | 245 |
| BAC | 139 | 104 | 243 |
| NHBAC | 119 | 88 | 207 |
| HTOM | 81 | 76 | 157 |
| AA | 57 | 97 | 154 |
| NHAA | 55 | 92 | 147 |
| BA | 80 | 47 | 127 |
| NHBA | 73 | 42 | 115 |
| NAC | 48 | 29 | 77 |
| NHNAC | 45 | 25 | 70 |
| NA | 24 | 12 | 36 |
| HBAC | 20 | 16 | 36 |
| NHNA | 22 | 10 | 32 |
| HAAC | 12 | 12 | 24 |
| HBA | 7 | 5 | 12 |
| HNAC | 3 | 4 | 7 |
| HAA | 2 | 5 | 7 |
| HNA | 2 | 2 | 4 |
• Missoula County population
43.5 mi,  168°
168°
• Flathead County
46.4 mi,  1°
1°
• Lewis and Clark County
87.3 mi,  114°
114°
• Lincoln County
89.4 mi,  314°
314°
• Glacier County
89 mi,  34°
34°
• Shoshone County
86.5 mi,  256°
256°
• Sanders County
51.6 mi,  278°
278°
• Powell County
77.2 mi,  135°
135°
• Teton County
84.6 mi,  81°
81°
• Mineral County
56.9 mi,  233°
233°
[0] Calculated by population.us from last known population growth rate, not official data.
[1] County population - 2014, archived from the original, retrieved 02/23/2016
[1b] Annual County Resident Population Estimates by Age, Sex, Race, and Hispanic Origin, (used only data for 2014) archived from the original, retrieved 02/23/2016
[2] County population - 2000-2010, archived from the original, retrieved 02/23/2016
[3] Population of States and Counties of the United States: 1790 to 1992, PDF, 15 Mb, census.gov, retrieved 02/23/2016
[4] County area, latitude longitude data, retrieved 02/23/2016
[5] County boundaries, CSV files on boundaries.us, retrived 03/18/2016
*Flathead, Missoula Montana Notes
Page generated in 0.013 seconds© 2016 population.us | Terms of use | Contact