Last official estimated population of Burleigh County was 81,689 (year 2014)[1]. This was 0.026% of total US population and 10.8% of total North Dakota state population. Area of Burleigh County is 1,668.3 mi² (=4320.9 km²), in this year population density was 48.97 p/mi². If population growth rate would be same as in period 2010-2014 (+0.12%/yr), Burleigh County population in 2026 would be 82,843 [0].
Historical population of Burleigh County for period 1880-2014 [1] , [2] , [3]:
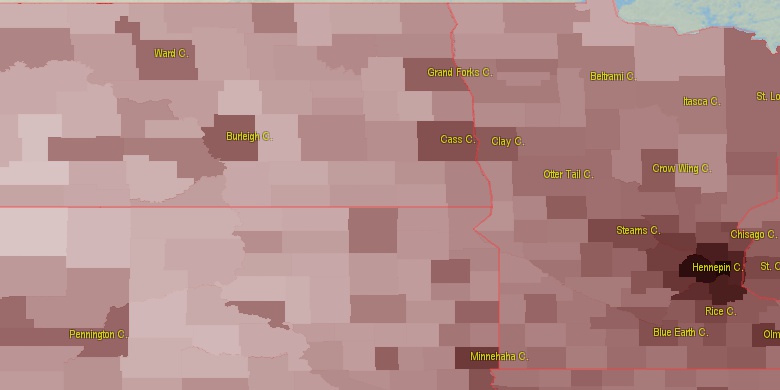
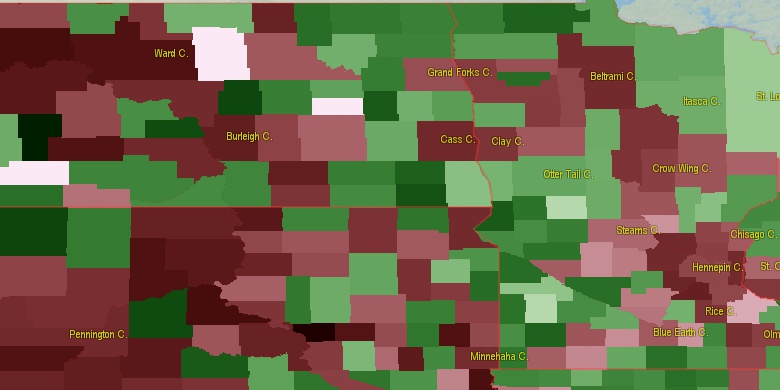
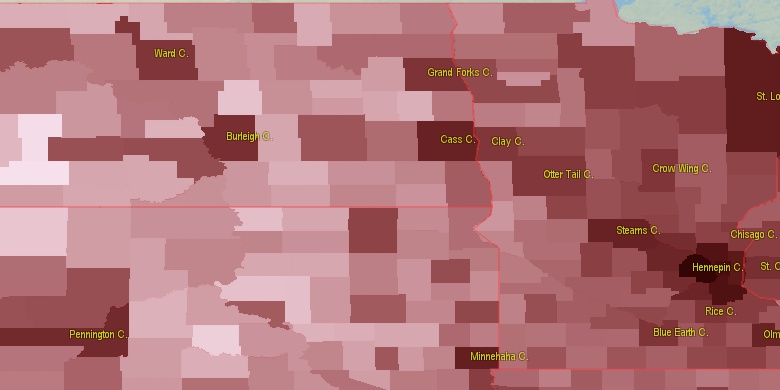
Estimated population for 2014[1]. Population density is in p./sq.mi [4]. Changes are for period 2010-2015. Value is %/year. Boundary lines are approx. 2012 [5]. Click on flag to hide it.
Population • Density • Changes • Legends • Position

[1880-1890] +2.72 %/yr
[1890-1900] +3.65 %/yr
[1900-1910] +7.97 %/yr
[1910-1920] +1.76 %/yr
[1920-1930] +2.41 %/yr
[1930-1940] +1.41 %/yr
[1940-1950] +1.22 %/yr
[1950-1960] +2.85 %/yr
[1960-1970] +1.81 %/yr
[1970-1980] +3.02 %/yr
[1980-1990] +0.93 %/yr
[1990-2000] +1.45 %/yr
[2000-2005] +1.39 %/yr
[2005-2010] +1.8 %/yr
[2010-2014] +0.12 %/yr
Looking for settlements in Burleigh County? Visit this page: Settlements in Burleigh County, ND
Population of Burleigh County by age groups male (M) and female (F)[1b]
| Age Gr. | (M) | (F) | Total |
| 0 to 4 | 3044 | 2970 | 6,014 |
| 5 to 9 | 3063 | 2919 | 5,982 |
| 10 to 14 | 2794 | 2575 | 5,369 |
| 15 to 19 | 2864 | 2876 | 5,740 |
| 20 to 24 | 3345 | 3251 | 6,596 |
| 25 to 29 | 3520 | 3096 | 6,616 |
| 30 to 34 | 3550 | 3250 | 6,800 |
| 35 to 39 | 2977 | 2749 | 5,726 |
| 40 to 44 | 2739 | 2536 | 5,275 |
| 45 to 49 | 2725 | 2568 | 5,293 |
| 50 to 54 | 3043 | 3201 | 6,244 |
| 55 to 59 | 3033 | 3304 | 6,337 |
| 60 to 64 | 2646 | 2771 | 5,417 |
| 65 to 69 | 1981 | 2081 | 4,062 |
| 70 to 74 | 1396 | 1500 | 2,896 |
| 75 to 79 | 918 | 1292 | 2,210 |
| 80 to 84 | 744 | 1106 | 1,850 |
| 85+ | 678 | 1398 | 2,076 |
Burleigh County resident population estimates by Sex, Race, and Hispanic Origin[1b]. For full list of abbrevations see: population.us/about page.
| Race | Male | Female | Total |
| NH | 44132 | 44664 | 88,796 |
| WAC | 42113 | 42765 | 84,878 |
| WA | 41415 | 42078 | 83,493 |
| NHWAC | 41347 | 42095 | 83,442 |
| NHWA | 40708 | 41451 | 82,159 |
| IAC | 2287 | 2307 | 4,594 |
| NHIAC | 2125 | 2201 | 4,326 |
| IA | 1865 | 1876 | 3,741 |
| NHIA | 1752 | 1804 | 3,556 |
| H | 928 | 779 | 1,707 |
| BAC | 959 | 589 | 1,548 |
| TOM | 755 | 746 | 1,501 |
| NHBAC | 905 | 550 | 1,455 |
| HWAC | 766 | 670 | 1,436 |
| NHTOM | 690 | 697 | 1,387 |
| HWA | 707 | 627 | 1,334 |
| BA | 723 | 372 | 1,095 |
| NHBA | 688 | 351 | 1,039 |
| AAC | 431 | 500 | 931 |
| NHAAC | 418 | 484 | 902 |
| AA | 278 | 347 | 625 |
| NHAA | 270 | 338 | 608 |
| HIAC | 162 | 106 | 268 |
| HIA | 113 | 72 | 185 |
| HTOM | 65 | 49 | 114 |
| NAC | 51 | 53 | 104 |
| NHNAC | 49 | 50 | 99 |
| HBAC | 54 | 39 | 93 |
| HBA | 35 | 21 | 56 |
| NA | 24 | 24 | 48 |
| NHNA | 24 | 23 | 47 |
| HAAC | 13 | 16 | 29 |
| HAA | 8 | 9 | 17 |
| HNAC | 2 | 3 | 5 |
| HNA | 0 | 1 | 1 |
• Morton County population
43.4 mi,  245°
245°
• McLean County
65.1 mi,  316°
316°
• Mercer County
68.5 mi,  289°
289°
• Wells County
55.7 mi,  40°
40°
• Sioux County
66 mi,  205°
205°
• Emmons County
48.7 mi,  167°
167°
• Kidder County
34.5 mi,  93°
93°
• Logan County
57.1 mi,  127°
127°
• Oliver County
42.2 mi,  283°
283°
• Sheridan County
42.6 mi,  8°
8°
[0] Calculated by population.us from last known population growth rate, not official data.
[1] County population - 2014, archived from the original, retrieved 02/23/2016
[1b] Annual County Resident Population Estimates by Age, Sex, Race, and Hispanic Origin, (used only data for 2014) archived from the original, retrieved 02/23/2016
[2] County population - 2000-2010, archived from the original, retrieved 02/23/2016
[3] Population of States and Counties of the United States: 1790 to 1992, PDF, 15 Mb, census.gov, retrieved 02/23/2016
[4] County area, latitude longitude data, retrieved 02/23/2016
[5] County boundaries, CSV files on boundaries.us, retrived 03/18/2016
Page generated in 0.009 seconds© 2016 population.us | Terms of use | Contact