Last official estimated population of Morton County was 27,565 (year 2014)[1]. This was 0.009% of total US population and 3.6% of total North Dakota state population. Area of Morton County is 1,945.4 mi² (=5038.7 km²), in this year population density was 14.17 p/mi². If population growth rate would be same as in period 2010-2014 (+0.09%/yr), Morton County population in 2026 would be 27,849 [0].
Historical population of Morton County for period 1880-2014 [1] , [2] , [3]:
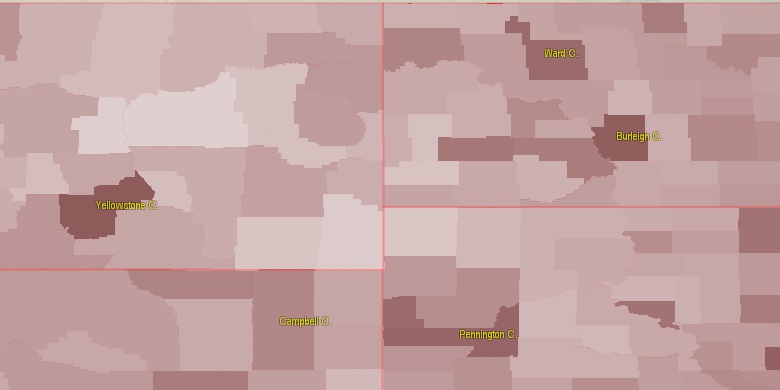
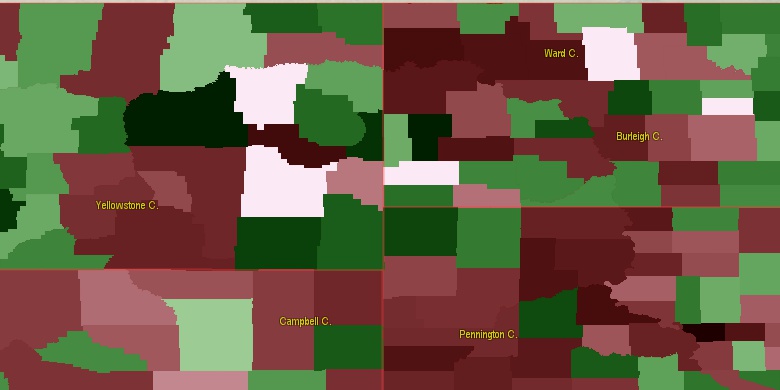
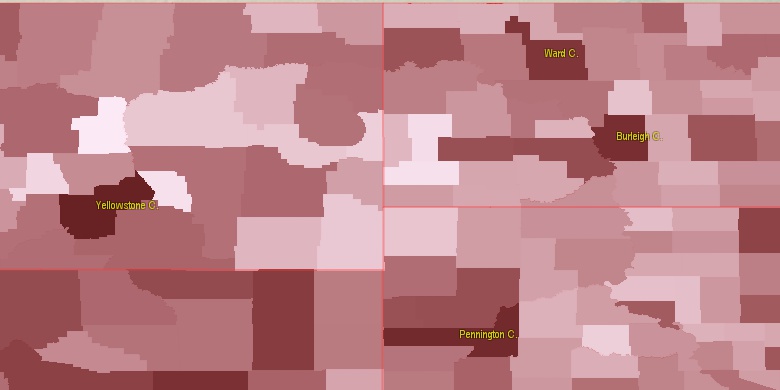
Estimated population for 2014[1]. Population density is in p./sq.mi [4]. Changes are for period 2010-2015. Value is %/year. Boundary lines are approx. 2012 [5]. Click on flag to hide it.
Population • Density • Changes • Legends • Position

[1880-1890] +37.2 %/yr
[1890-1900] +5.49 %/yr
[1900-1910] +12.1 %/yr
[1910-1920] -2.97 %/yr
[1920-1930] +0.49 %/yr
[1930-1940] +0.27 %/yr
[1940-1950] -0.45 %/yr
[1950-1960] +0.85 %/yr
[1960-1970] -0.33 %/yr
[1970-1980] +2.17 %/yr
[1980-1990] -0.6 %/yr
[1990-2000] +0.66 %/yr
[2000-2005] +0.22 %/yr
[2005-2010] +1.44 %/yr
[2010-2014] +0.09 %/yr
Looking for settlements in Morton County? Visit this page: Settlements in Morton County, ND
Population of Morton County by age groups male (M) and female (F)[1b]
| Age Gr. | (M) | (F) | Total |
| 0 to 4 | 1058 | 977 | 2,035 |
| 5 to 9 | 1028 | 950 | 1,978 |
| 10 to 14 | 906 | 876 | 1,782 |
| 15 to 19 | 908 | 859 | 1,767 |
| 20 to 24 | 997 | 866 | 1,863 |
| 25 to 29 | 1172 | 1058 | 2,230 |
| 30 to 34 | 1188 | 1080 | 2,268 |
| 35 to 39 | 936 | 879 | 1,815 |
| 40 to 44 | 862 | 870 | 1,732 |
| 45 to 49 | 914 | 869 | 1,783 |
| 50 to 54 | 1077 | 1069 | 2,146 |
| 55 to 59 | 1117 | 1061 | 2,178 |
| 60 to 64 | 916 | 882 | 1,798 |
| 65 to 69 | 712 | 714 | 1,426 |
| 70 to 74 | 494 | 512 | 1,006 |
| 75 to 79 | 340 | 403 | 743 |
| 80 to 84 | 235 | 371 | 606 |
| 85+ | 227 | 439 | 666 |
Morton County resident population estimates by Sex, Race, and Hispanic Origin[1b]. For full list of abbrevations see: population.us/about page.
| Race | Male | Female | Total |
| NH | 14653 | 14376 | 29,029 |
| WAC | 14237 | 13951 | 28,188 |
| WA | 13973 | 13652 | 27,625 |
| NHWAC | 13899 | 13680 | 27,579 |
| NHWA | 13663 | 13414 | 27,077 |
| IAC | 749 | 803 | 1,552 |
| NHIAC | 661 | 702 | 1,363 |
| IA | 571 | 602 | 1,173 |
| NHIA | 504 | 522 | 1,026 |
| H | 434 | 359 | 793 |
| HWAC | 338 | 271 | 609 |
| TOM | 287 | 310 | 597 |
| HWA | 310 | 238 | 548 |
| NHTOM | 253 | 276 | 529 |
| BAC | 248 | 176 | 424 |
| NHBAC | 216 | 158 | 374 |
| BA | 167 | 98 | 265 |
| NHBA | 148 | 93 | 241 |
| AAC | 115 | 112 | 227 |
| NHAAC | 103 | 102 | 205 |
| HIAC | 88 | 101 | 189 |
| HIA | 67 | 80 | 147 |
| AA | 67 | 57 | 124 |
| NHAA | 63 | 55 | 118 |
| HTOM | 34 | 34 | 68 |
| NAC | 33 | 28 | 61 |
| NHNAC | 31 | 24 | 55 |
| HBAC | 32 | 18 | 50 |
| NHNA | 22 | 16 | 38 |
| NA | 22 | 16 | 38 |
| HBA | 19 | 5 | 24 |
| HAAC | 12 | 10 | 22 |
| HAA | 4 | 2 | 6 |
| HNAC | 2 | 4 | 6 |
| HNA | 0 | 0 | 0 |
• Burleigh County population
43.4 mi,  65°
65°
• Stark County
65 mi,  276°
276°
• McLean County
65.4 mi,  354°
354°
• Mercer County
48.3 mi,  328°
328°
• Sioux County
43 mi,  164°
164°
• Corson County
71.1 mi,  175°
175°
• Emmons County
58.4 mi,  120°
120°
• Hettinger County
58.1 mi,  250°
250°
• Grant County
29.3 mi,  213°
213°
• Oliver County
28.2 mi,  356°
356°
[0] Calculated by population.us from last known population growth rate, not official data.
[1] County population - 2014, archived from the original, retrieved 02/23/2016
[1b] Annual County Resident Population Estimates by Age, Sex, Race, and Hispanic Origin, (used only data for 2014) archived from the original, retrieved 02/23/2016
[2] County population - 2000-2010, archived from the original, retrieved 02/23/2016
[3] Population of States and Counties of the United States: 1790 to 1992, PDF, 15 Mb, census.gov, retrieved 02/23/2016
[4] County area, latitude longitude data, retrieved 02/23/2016
[5] County boundaries, CSV files on boundaries.us, retrived 03/18/2016
Page generated in 0.013 seconds© 2016 population.us | Terms of use | Contact