Last official estimated population of Hettinger County was 2,472 (year 2014)[1]. This was 0.001% of total US population and 0.3% of total North Dakota state population. Area of Hettinger County is 1,133.8 mi² (=2936.5 km²), in this year population density was 2.18 p/mi². If population growth rate would be same as in period 2010-2014 (-0.05%/yr), Hettinger County population in 2026 would be 2,457 [0].
Historical population of Hettinger County for period 1890-2014 [1] , [2] , [3]:
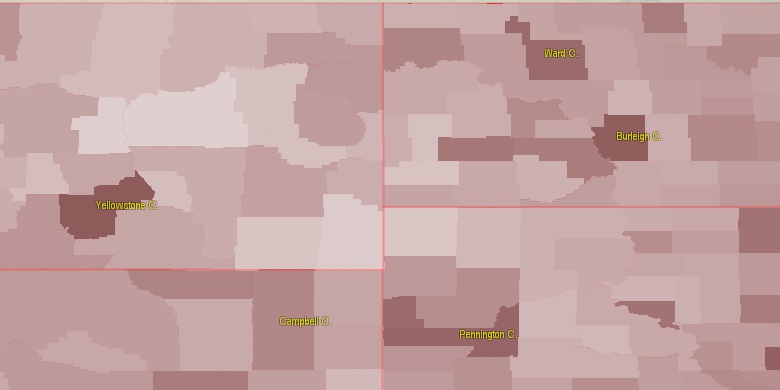
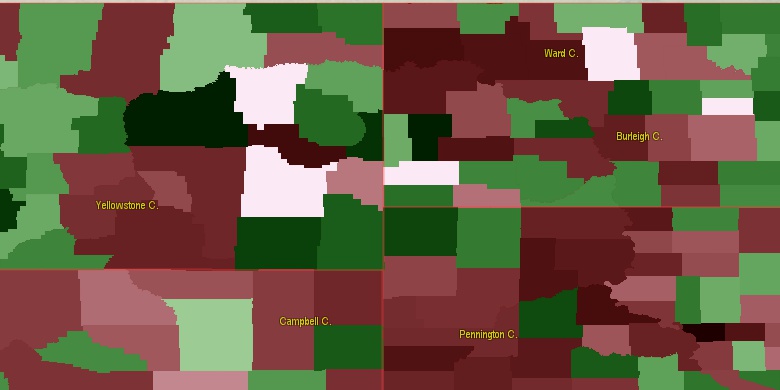
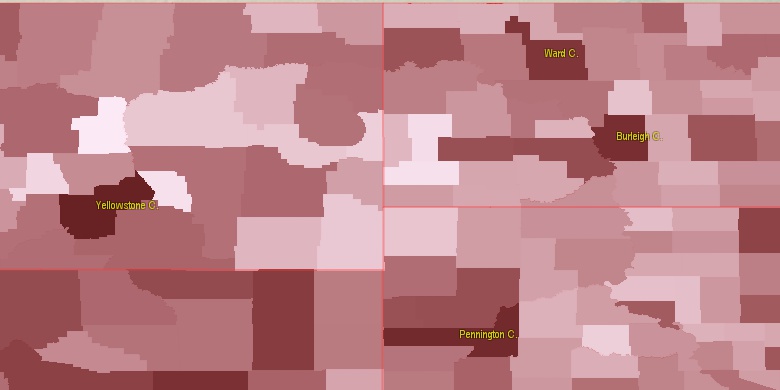
Estimated population for 2014[1]. Population density is in p./sq.mi [4]. Changes are for period 2010-2015. Value is %/year. Boundary lines are approx. 2012 [5]. Click on flag to hide it.
Population • Density • Changes • Legends • Position

[1890-1910] +24.57 %/yr
[1910-1920] +1.6 %/yr
[1920-1930] +1.36 %/yr
[1930-1940] -1.64 %/yr
[1940-1950] -0.49 %/yr
[1950-1960] -1.16 %/yr
[1960-1970] -2.17 %/yr
[1970-1980] -1.7 %/yr
[1980-1990] -2.14 %/yr
[1990-2000] -2.35 %/yr
[2000-2005] -0.96 %/yr
[2005-2010] -0.87 %/yr
[2010-2014] -0.05 %/yr
Looking for settlements in Hettinger County? Visit this page: Settlements in Hettinger County, ND
Population of Hettinger County by age groups male (M) and female (F)[1b]
| Age Gr. | (M) | (F) | Total |
| 0 to 4 | 92 | 77 | 169 |
| 5 to 9 | 76 | 96 | 172 |
| 10 to 14 | 79 | 87 | 166 |
| 15 to 19 | 70 | 79 | 149 |
| 20 to 24 | 73 | 61 | 134 |
| 25 to 29 | 61 | 92 | 153 |
| 30 to 34 | 78 | 76 | 154 |
| 35 to 39 | 47 | 69 | 116 |
| 40 to 44 | 68 | 70 | 138 |
| 45 to 49 | 70 | 89 | 159 |
| 50 to 54 | 93 | 96 | 189 |
| 55 to 59 | 96 | 86 | 182 |
| 60 to 64 | 90 | 79 | 169 |
| 65 to 69 | 66 | 73 | 139 |
| 70 to 74 | 70 | 66 | 136 |
| 75 to 79 | 64 | 59 | 123 |
| 80 to 84 | 53 | 62 | 115 |
| 85+ | 45 | 52 | 97 |
Hettinger County resident population estimates by Sex, Race, and Hispanic Origin[1b]. For full list of abbrevations see: population.us/about page.
| Race | Male | Female | Total |
| NH | 1260 | 1340 | 2,600 |
| WAC | 1262 | 1294 | 2,556 |
| WA | 1244 | 1269 | 2,513 |
| NHWAC | 1232 | 1271 | 2,503 |
| NHWA | 1216 | 1246 | 2,462 |
| IAC | 29 | 75 | 104 |
| NHIAC | 28 | 70 | 98 |
| IA | 17 | 60 | 77 |
| NHIA | 16 | 55 | 71 |
| H | 31 | 29 | 60 |
| HWAC | 30 | 23 | 53 |
| HWA | 28 | 23 | 51 |
| TOM | 18 | 28 | 46 |
| NHTOM | 16 | 28 | 44 |
| NHBAC | 14 | 19 | 33 |
| BAC | 14 | 19 | 33 |
| BA | 10 | 7 | 17 |
| NHBA | 10 | 7 | 17 |
| AAC | 4 | 7 | 11 |
| NHAAC | 2 | 6 | 8 |
| HIAC | 1 | 5 | 6 |
| HIA | 1 | 5 | 6 |
| NAC | 1 | 4 | 5 |
| NHNAC | 1 | 4 | 5 |
| AA | 1 | 3 | 4 |
| HAAC | 2 | 1 | 3 |
| NHAA | 1 | 2 | 3 |
| NHNA | 1 | 2 | 3 |
| NA | 1 | 2 | 3 |
| HTOM | 2 | 0 | 2 |
| HAA | 0 | 1 | 1 |
| HNAC | 0 | 0 | 0 |
| HBA | 0 | 0 | 0 |
| HNA | 0 | 0 | 0 |
| HBAC | 0 | 0 | 0 |
• Morton County population
58.1 mi,  70°
70°
• Stark County
28.1 mi,  339°
339°
• Mercer County
67 mi,  25°
25°
• Dunn County
63.9 mi,  353°
353°
• Bowman County
55 mi,  245°
245°
• Perkins County
65.8 mi,  180°
180°
• Grant County
39.2 mi,  97°
97°
• Adams County
23.7 mi,  189°
189°
• Billings County
58.4 mi,  312°
312°
• Slope County
48 mi,  270°
270°
[0] Calculated by population.us from last known population growth rate, not official data.
[1] County population - 2014, archived from the original, retrieved 02/23/2016
[1b] Annual County Resident Population Estimates by Age, Sex, Race, and Hispanic Origin, (used only data for 2014) archived from the original, retrieved 02/23/2016
[2] County population - 2000-2010, archived from the original, retrieved 02/23/2016
[3] Population of States and Counties of the United States: 1790 to 1992, PDF, 15 Mb, census.gov, retrieved 02/23/2016
[4] County area, latitude longitude data, retrieved 02/23/2016
[5] County boundaries, CSV files on boundaries.us, retrived 03/18/2016
*Stark; see note 3 North Dakota Notes
Page generated in 0.021 seconds© 2016 population.us | Terms of use | Contact