Last official estimated population of Corson County was 4,067 (year 2014)[1]. This was 0.001% of total US population and 0.5% of total South Dakota state population. Area of Corson County is 2,529.6 mi² (=6551.8 km²), in this year population density was 1.61 p/mi². If population growth rate would be same as in period 2010-2014 (+0.1%/yr), Corson County population in 2026 would be 4,118 [0].
Historical population of Corson County for period 1910-2014 [1] , [2] , [3]:
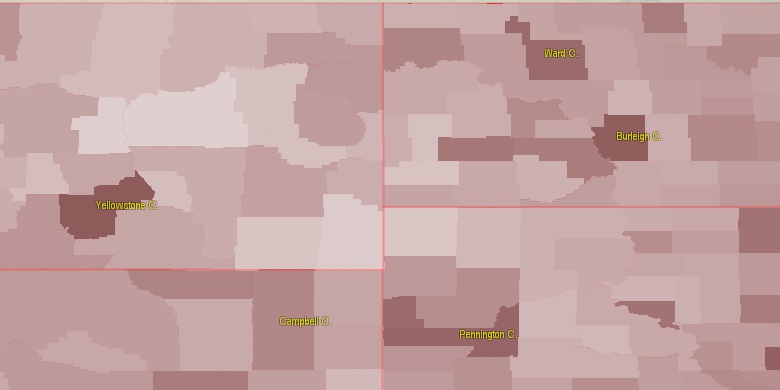
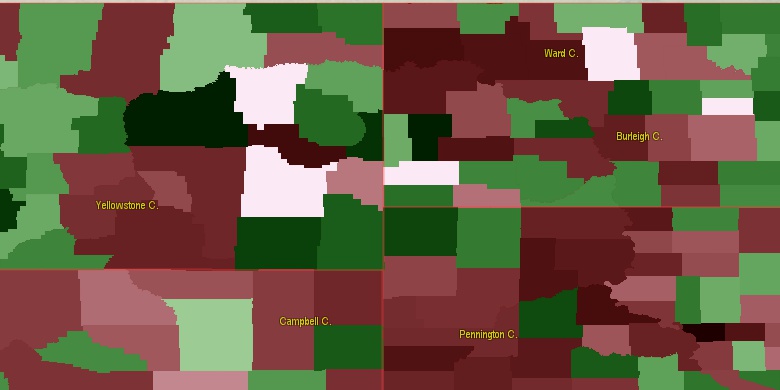
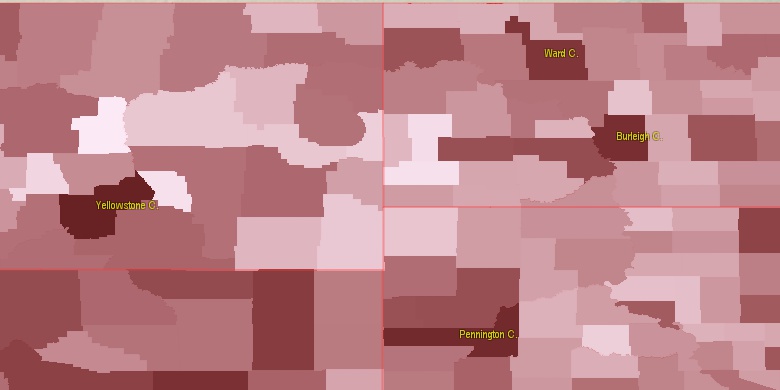
Estimated population for 2014[1]. Population density is in p./sq.mi [4]. Changes are for period 2010-2015. Value is %/year. Boundary lines are approx. 2012 [5]. Click on flag to hide it.
Population • Density • Changes • Legends • Position

[1910-1920] +9.49 %/yr
[1920-1930] +2.78 %/yr
[1930-1940] -3.39 %/yr
[1940-1950] -0.9 %/yr
[1950-1960] -0.62 %/yr
[1960-1970] -1.48 %/yr
[1970-1980] +0.4 %/yr
[1980-1990] -2.12 %/yr
[1990-2000] -0.04 %/yr
[2000-2005] +0.17 %/yr
[2005-2010] -0.79 %/yr
[2010-2014] +0.1 %/yr
Looking for settlements in Corson County? Visit this page: Settlements in Corson County, SD
Population of Corson County by age groups male (M) and female (F)[1b]
| Age Gr. | (M) | (F) | Total |
| 0 to 4 | 203 | 189 | 392 |
| 5 to 9 | 216 | 202 | 418 |
| 10 to 14 | 223 | 206 | 429 |
| 15 to 19 | 162 | 167 | 329 |
| 20 to 24 | 144 | 141 | 285 |
| 25 to 29 | 118 | 128 | 246 |
| 30 to 34 | 140 | 122 | 262 |
| 35 to 39 | 114 | 115 | 229 |
| 40 to 44 | 111 | 86 | 197 |
| 45 to 49 | 129 | 118 | 247 |
| 50 to 54 | 135 | 123 | 258 |
| 55 to 59 | 130 | 129 | 259 |
| 60 to 64 | 98 | 94 | 192 |
| 65 to 69 | 80 | 67 | 147 |
| 70 to 74 | 56 | 51 | 107 |
| 75 to 79 | 35 | 43 | 78 |
| 80 to 84 | 27 | 34 | 61 |
| 85+ | 24 | 22 | 46 |
Corson County resident population estimates by Sex, Race, and Hispanic Origin[1b]. For full list of abbrevations see: population.us/about page.
| Race | Male | Female | Total |
| NH | 2033 | 1987 | 4,020 |
| IAC | 1391 | 1381 | 2,772 |
| IA | 1348 | 1327 | 2,675 |
| NHIAC | 1302 | 1342 | 2,644 |
| NHIA | 1259 | 1291 | 2,550 |
| WAC | 772 | 695 | 1,467 |
| NHWAC | 750 | 683 | 1,433 |
| WA | 720 | 628 | 1,348 |
| NHWA | 698 | 619 | 1,317 |
| H | 112 | 50 | 162 |
| TOM | 58 | 72 | 130 |
| HIAC | 89 | 39 | 128 |
| NHTOM | 58 | 68 | 126 |
| HIA | 89 | 36 | 125 |
| BAC | 24 | 17 | 41 |
| NHBAC | 23 | 15 | 38 |
| HWAC | 22 | 12 | 34 |
| HWA | 22 | 9 | 31 |
| NHAAC | 15 | 15 | 30 |
| AAC | 15 | 15 | 30 |
| AA | 9 | 7 | 16 |
| NHAA | 9 | 7 | 16 |
| BA | 9 | 1 | 10 |
| NHBA | 8 | 1 | 9 |
| NAC | 5 | 2 | 7 |
| NHNAC | 5 | 1 | 6 |
| HTOM | 0 | 4 | 4 |
| NA | 1 | 2 | 3 |
| HBAC | 1 | 2 | 3 |
| NHNA | 1 | 1 | 2 |
| HBA | 1 | 0 | 1 |
| HNAC | 0 | 1 | 1 |
| HNA | 0 | 1 | 1 |
| HAA | 0 | 0 | 0 |
| HAAC | 0 | 0 | 0 |
• Morton County population
71.1 mi,  355°
355°
• Walworth County
58.5 mi,  107°
107°
• Dewey County
40.7 mi,  155°
155°
• Sioux County
29.9 mi,  10°
10°
• Emmons County
61.3 mi,  47°
47°
• Perkins County
63.8 mi,  257°
257°
• Ziebach County
53.5 mi,  205°
205°
• Grant County
51.4 mi,  334°
334°
• Adams County
71 mi,  293°
293°
• Campbell County
57.2 mi,  83°
83°
[0] Calculated by population.us from last known population growth rate, not official data.
[1] County population - 2014, archived from the original, retrieved 02/23/2016
[1b] Annual County Resident Population Estimates by Age, Sex, Race, and Hispanic Origin, (used only data for 2014) archived from the original, retrieved 02/23/2016
[2] County population - 2000-2010, archived from the original, retrieved 02/23/2016
[3] Population of States and Counties of the United States: 1790 to 1992, PDF, 15 Mb, census.gov, retrieved 02/23/2016
[4] County area, latitude longitude data, retrieved 02/23/2016
[5] County boundaries, CSV files on boundaries.us, retrived 03/18/2016
*Standing Rock Reservation South Dakota Notes
Page generated in 0.022 seconds© 2016 population.us | Terms of use | Contact