Last official estimated population of Crane County was 4,376 (year 2014)[1]. This was 0.001% of total US population and 0% of total Texas state population. Area of Crane County is 785.7 mi² (=2035 km²), in this year population density was 5.57 p/mi². If population growth rate would be same as in period 2010-2014 (+0.01%/yr), Crane County population in 2026 would be 4,379 [0].
Historical population of Crane County for period 1890-2014 [1] , [2] , [3]:
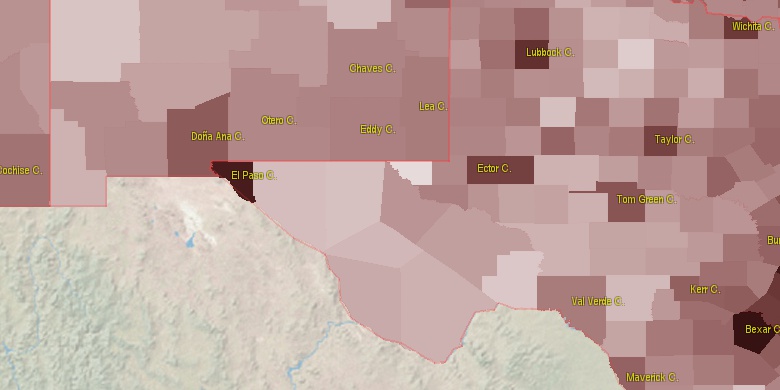
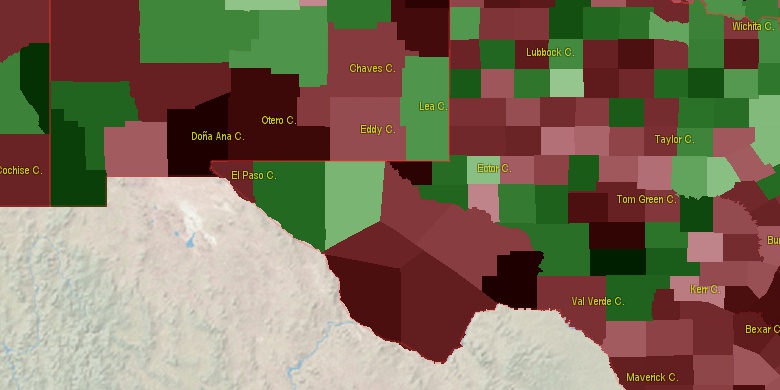
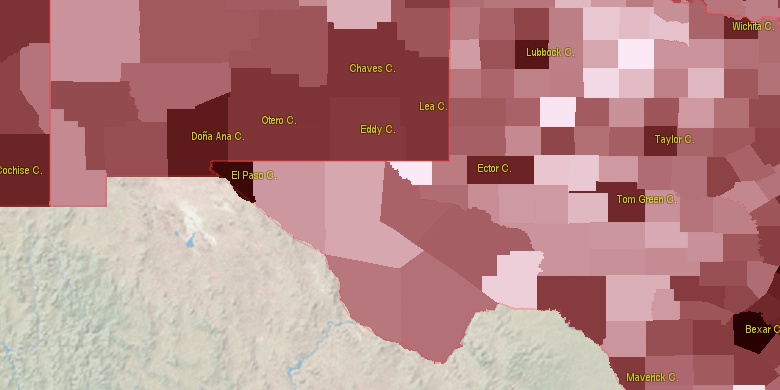
Estimated population for 2014[1]. Population density is in p./sq.mi [4]. Changes are for period 2010-2015. Value is %/year. Boundary lines are approx. 2012 [5]. Click on flag to hide it.
Population • Density • Changes • Legends • Position

[1890-1900] +13.02 %/yr
[1900-1910] +20.57 %/yr
[1910-1920] -19.68 %/yr
[1920-1930] +50.6 %/yr
[1930-1940] +2.49 %/yr
[1940-1950] +3.39 %/yr
[1950-1960] +1.71 %/yr
[1960-1970] -1.18 %/yr
[1970-1980] +0.98 %/yr
[1980-1990] +0.11 %/yr
[1990-2000] -1.51 %/yr
[2000-2005] -0.79 %/yr
[2005-2010] +2.64 %/yr
[2010-2014] +0.01 %/yr
Looking for settlements in Crane County? Visit this page: Settlements in Crane County, TX
Population of Crane County by age groups male (M) and female (F)[1b]
| Age Gr. | (M) | (F) | Total |
| 0 to 4 | 181 | 233 | 414 |
| 5 to 9 | 222 | 200 | 422 |
| 10 to 14 | 206 | 216 | 422 |
| 15 to 19 | 178 | 170 | 348 |
| 20 to 24 | 199 | 174 | 373 |
| 25 to 29 | 162 | 152 | 314 |
| 30 to 34 | 187 | 180 | 367 |
| 35 to 39 | 156 | 137 | 293 |
| 40 to 44 | 135 | 144 | 279 |
| 45 to 49 | 160 | 143 | 303 |
| 50 to 54 | 180 | 163 | 343 |
| 55 to 59 | 141 | 150 | 291 |
| 60 to 64 | 113 | 109 | 222 |
| 65 to 69 | 90 | 98 | 188 |
| 70 to 74 | 66 | 67 | 133 |
| 75 to 79 | 34 | 61 | 95 |
| 80 to 84 | 29 | 44 | 73 |
| 85+ | 24 | 46 | 70 |
Crane County resident population estimates by Sex, Race, and Hispanic Origin[1b]. For full list of abbrevations see: population.us/about page.
| Race | Male | Female | Total |
| WAC | 2319 | 2359 | 4,678 |
| WA | 2284 | 2335 | 4,619 |
| H | 1556 | 1506 | 3,062 |
| HWAC | 1499 | 1463 | 2,962 |
| HWA | 1481 | 1451 | 2,932 |
| NH | 907 | 981 | 1,888 |
| NHWAC | 820 | 896 | 1,716 |
| NHWA | 803 | 884 | 1,687 |
| BAC | 97 | 80 | 177 |
| BA | 81 | 68 | 149 |
| NHBAC | 70 | 60 | 130 |
| NHBA | 62 | 54 | 116 |
| IAC | 57 | 47 | 104 |
| IA | 42 | 35 | 77 |
| TOM | 36 | 26 | 62 |
| NHIAC | 24 | 29 | 53 |
| HIAC | 33 | 18 | 51 |
| HBAC | 27 | 20 | 47 |
| AAC | 23 | 23 | 46 |
| NHIA | 21 | 22 | 43 |
| AA | 17 | 20 | 37 |
| HIA | 21 | 13 | 34 |
| HBA | 19 | 14 | 33 |
| HTOM | 19 | 13 | 32 |
| NHTOM | 17 | 13 | 30 |
| HAAC | 13 | 14 | 27 |
| HAA | 13 | 12 | 25 |
| NHAAC | 10 | 9 | 19 |
| NHAA | 4 | 8 | 12 |
| HNAC | 3 | 5 | 8 |
| NAC | 3 | 5 | 8 |
| NA | 3 | 3 | 6 |
| HNA | 3 | 3 | 6 |
| NHNA | 0 | 0 | 0 |
| NHNAC | 0 | 0 | 0 |
• Ector County population
30.7 mi,  353°
353°
• Midland County
41.2 mi,  41°
41°
• Pecos County
47.1 mi,  196°
196°
• Andrews County
62.1 mi, 351°
• Ward County
36.9 mi,  279°
279°
• Winkler County
43.8 mi,  310°
310°
• Martin County
68.6 mi,  26°
26°
• Reagan County
57.5 mi,  93°
93°
• Upton County
26.7 mi,  100°
100°
• Glasscock County
64.6 mi,  61°
61°
[0] Calculated by population.us from last known population growth rate, not official data.
[1] County population - 2014, archived from the original, retrieved 02/23/2016
[1b] Annual County Resident Population Estimates by Age, Sex, Race, and Hispanic Origin, (used only data for 2014) archived from the original, retrieved 02/23/2016
[2] County population - 2000-2010, archived from the original, retrieved 02/23/2016
[3] Population of States and Counties of the United States: 1790 to 1992, PDF, 15 Mb, census.gov, retrieved 02/23/2016
[4] County area, latitude longitude data, retrieved 02/23/2016
[5] County boundaries, CSV files on boundaries.us, retrived 03/18/2016
*Tom Green Texas Notes
Page generated in 0.021 seconds© 2016 population.us | Terms of use | Contact