Last official estimated population of Ward County was 10,612 (year 2014)[1]. This was 0.003% of total US population and 0% of total Texas state population. Area of Ward County is 835.8 mi² (=2164.8 km²), in this year population density was 12.70 p/mi². If population growth rate would be same as in period 2010-2014 (-0.11%/yr), Ward County population in 2026 would be 10,475 [0].
Historical population of Ward County for period 1890-2014 [1] , [2] , [3]:
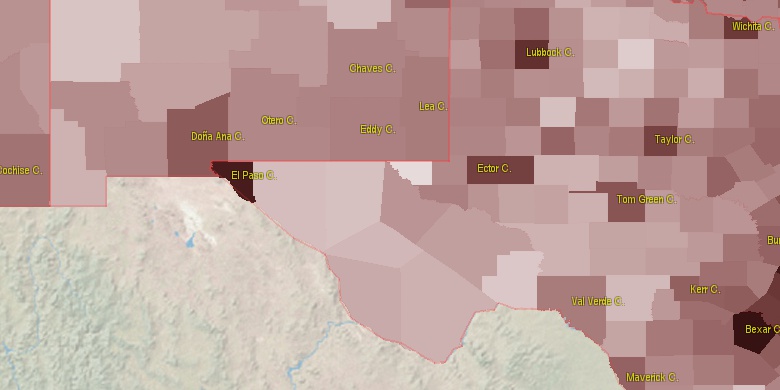
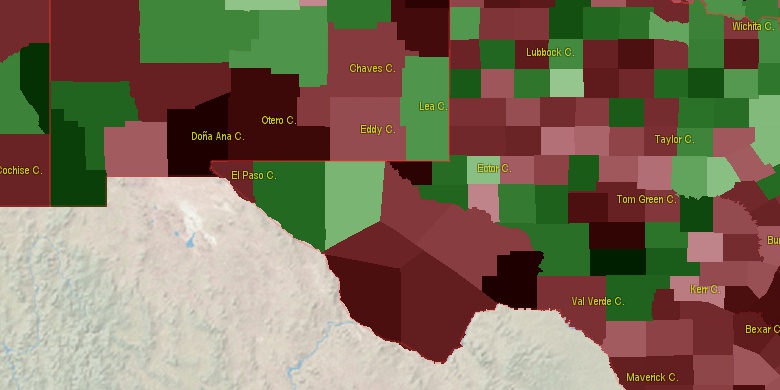
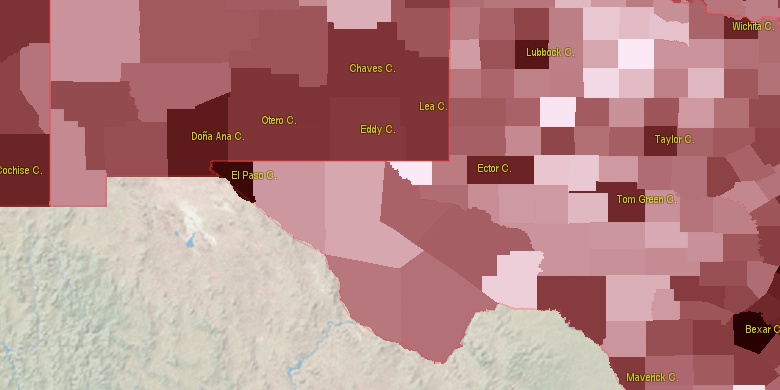
Estimated population for 2014[1]. Population density is in p./sq.mi [4]. Changes are for period 2010-2015. Value is %/year. Boundary lines are approx. 2012 [5]. Click on flag to hide it.
Population • Density • Changes • Legends • Position

[1890-1900] +34.13 %/yr
[1900-1910] +5.11 %/yr
[1910-1920] +0.91 %/yr
[1920-1930] +5.81 %/yr
[1930-1940] +7.61 %/yr
[1940-1950] +3.38 %/yr
[1950-1960] +1.12 %/yr
[1960-1970] -1.35 %/yr
[1970-1980] +0.71 %/yr
[1980-1990] -0.63 %/yr
[1990-2000] -1.82 %/yr
[2000-2005] -1.27 %/yr
[2005-2010] +0.82 %/yr
[2010-2014] -0.11 %/yr
Looking for settlements in Ward County? Visit this page: Settlements in Ward County, TX
Population of Ward County by age groups male (M) and female (F)[1b]
| Age Gr. | (M) | (F) | Total |
| 0 to 4 | 475 | 451 | 926 |
| 5 to 9 | 440 | 482 | 922 |
| 10 to 14 | 461 | 448 | 909 |
| 15 to 19 | 409 | 395 | 804 |
| 20 to 24 | 406 | 387 | 793 |
| 25 to 29 | 426 | 386 | 812 |
| 30 to 34 | 440 | 399 | 839 |
| 35 to 39 | 366 | 315 | 681 |
| 40 to 44 | 314 | 321 | 635 |
| 45 to 49 | 342 | 310 | 652 |
| 50 to 54 | 342 | 379 | 721 |
| 55 to 59 | 346 | 376 | 722 |
| 60 to 64 | 277 | 292 | 569 |
| 65 to 69 | 245 | 269 | 514 |
| 70 to 74 | 185 | 194 | 379 |
| 75 to 79 | 137 | 160 | 297 |
| 80 to 84 | 108 | 135 | 243 |
| 85+ | 59 | 148 | 207 |
Ward County resident population estimates by Sex, Race, and Hispanic Origin[1b]. For full list of abbrevations see: population.us/about page.
| Race | Male | Female | Total |
| WAC | 5343 | 5410 | 10,753 |
| WA | 5235 | 5323 | 10,558 |
| H | 3033 | 2958 | 5,991 |
| HWAC | 2904 | 2815 | 5,719 |
| HWA | 2860 | 2791 | 5,651 |
| NH | 2745 | 2889 | 5,634 |
| NHWAC | 2439 | 2595 | 5,034 |
| NHWA | 2375 | 2532 | 4,907 |
| BAC | 344 | 335 | 679 |
| BA | 294 | 277 | 571 |
| NHBAC | 267 | 260 | 527 |
| NHBA | 239 | 217 | 456 |
| IAC | 144 | 128 | 272 |
| TOM | 114 | 96 | 210 |
| IA | 98 | 99 | 197 |
| HIAC | 81 | 79 | 160 |
| HBAC | 77 | 75 | 152 |
| NHTOM | 67 | 70 | 137 |
| HIA | 61 | 69 | 130 |
| HBA | 55 | 60 | 115 |
| AAC | 53 | 62 | 115 |
| NHIAC | 63 | 49 | 112 |
| NHAAC | 40 | 52 | 92 |
| AA | 33 | 47 | 80 |
| HTOM | 47 | 26 | 73 |
| NHIA | 37 | 30 | 67 |
| NHAA | 27 | 39 | 66 |
| HAAC | 13 | 10 | 23 |
| NAC | 8 | 10 | 18 |
| HAA | 6 | 8 | 14 |
| HNAC | 5 | 5 | 10 |
| NA | 4 | 5 | 9 |
| HNA | 4 | 4 | 8 |
| NHNAC | 3 | 5 | 8 |
| NHNA | 0 | 1 | 1 |
• Ector County population
41.1 mi,  53°
53°
• Midland County
68.2 mi,  68°
68°
• Pecos County
56.1 mi,  156°
156°
• Andrews County
61.6 mi,  26°
26°
• Reeves County
38.5 mi,  248°
248°
• Winkler County
22.2 mi,  7°
7°
• Crane County
36.9 mi,  99°
99°
• Upton County
63.7 mi, 99°
• Culberson County
83.9 mi,  266°
266°
• Loving County
35.3 mi,  310°
310°
[0] Calculated by population.us from last known population growth rate, not official data.
[1] County population - 2014, archived from the original, retrieved 02/23/2016
[1b] Annual County Resident Population Estimates by Age, Sex, Race, and Hispanic Origin, (used only data for 2014) archived from the original, retrieved 02/23/2016
[2] County population - 2000-2010, archived from the original, retrieved 02/23/2016
[3] Population of States and Counties of the United States: 1790 to 1992, PDF, 15 Mb, census.gov, retrieved 02/23/2016
[4] County area, latitude longitude data, retrieved 02/23/2016
[5] County boundaries, CSV files on boundaries.us, retrived 03/18/2016
*Tom Green Texas Notes
Page generated in 0.019 seconds© 2016 population.us | Terms of use | Contact