Last official estimated population of Dickens County was 2,454 (year 2014)[1]. This was 0.001% of total US population and 0% of total Texas state population. Area of Dickens County is 905.2 mi² (=2344.5 km²), in this year population density was 2.71 p/mi². If population growth rate would be same as in period 2010-2014 (+0.1%/yr), Dickens County population in 2026 would be 2,484 [0].
Historical population of Dickens County for period 1880-2014 [1] , [2] , [3]:
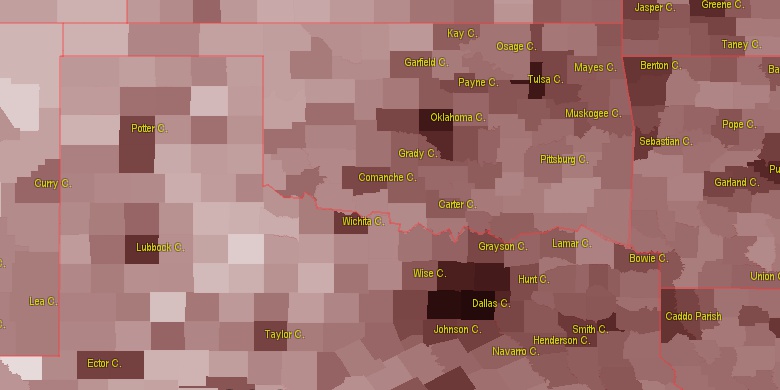
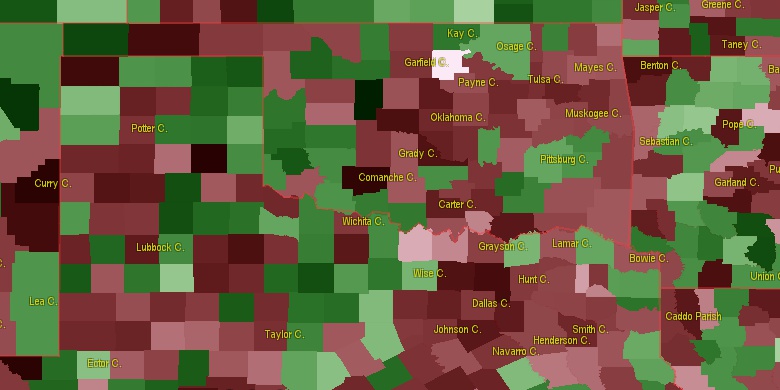
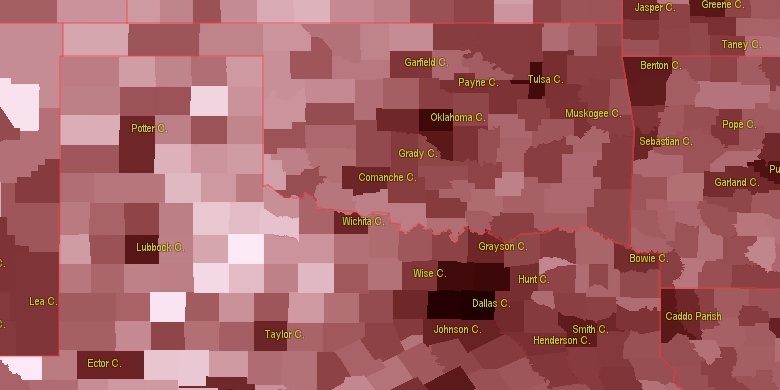
Estimated population for 2014[1]. Population density is in p./sq.mi [4]. Changes are for period 2010-2015. Value is %/year. Boundary lines are approx. 2012 [5]. Click on flag to hide it.
Population • Density • Changes • Legends • Position

[1880-1890] +26.55 %/yr
[1890-1900] +14.58 %/yr
[1900-1910] +10.39 %/yr
[1910-1920] +6.63 %/yr
[1920-1930] +3.88 %/yr
[1930-1940] -0.91 %/yr
[1940-1950] -0.89 %/yr
[1950-1960] -3.62 %/yr
[1960-1970] -2.8 %/yr
[1970-1980] -0.54 %/yr
[1980-1990] -3.14 %/yr
[1990-2000] +0.71 %/yr
[2000-2005] -1.47 %/yr
[2005-2010] -0.95 %/yr
[2010-2014] +0.1 %/yr
Looking for settlements in Dickens County? Visit this page: Settlements in Dickens County, TX
Population of Dickens County by age groups male (M) and female (F)[1b]
| Age Gr. | (M) | (F) | Total |
| 0 to 4 | 69 | 68 | 137 |
| 5 to 9 | 45 | 51 | 96 |
| 10 to 14 | 63 | 63 | 126 |
| 15 to 19 | 78 | 38 | 116 |
| 20 to 24 | 103 | 32 | 135 |
| 25 to 29 | 103 | 29 | 132 |
| 30 to 34 | 116 | 44 | 160 |
| 35 to 39 | 90 | 59 | 149 |
| 40 to 44 | 101 | 52 | 153 |
| 45 to 49 | 56 | 44 | 100 |
| 50 to 54 | 81 | 67 | 148 |
| 55 to 59 | 83 | 77 | 160 |
| 60 to 64 | 67 | 75 | 142 |
| 65 to 69 | 53 | 77 | 130 |
| 70 to 74 | 55 | 57 | 112 |
| 75 to 79 | 41 | 51 | 92 |
| 80 to 84 | 39 | 35 | 74 |
| 85+ | 34 | 22 | 56 |
Dickens County resident population estimates by Sex, Race, and Hispanic Origin[1b]. For full list of abbrevations see: population.us/about page.
| Race | Male | Female | Total |
| WAC | 1124 | 885 | 2,009 |
| WA | 1103 | 865 | 1,968 |
| NH | 847 | 716 | 1,563 |
| NHWAC | 731 | 679 | 1,410 |
| NHWA | 721 | 673 | 1,394 |
| H | 430 | 225 | 655 |
| HWAC | 393 | 206 | 599 |
| HWA | 382 | 192 | 574 |
| BAC | 115 | 39 | 154 |
| BA | 106 | 27 | 133 |
| NHBAC | 94 | 24 | 118 |
| NHBA | 90 | 20 | 110 |
| IAC | 41 | 25 | 66 |
| IA | 32 | 15 | 47 |
| TOM | 22 | 22 | 44 |
| HIAC | 23 | 15 | 38 |
| HBAC | 21 | 15 | 36 |
| AAC | 19 | 12 | 31 |
| NHIAC | 18 | 10 | 28 |
| HIA | 18 | 8 | 26 |
| HTOM | 11 | 15 | 26 |
| NHAAC | 15 | 10 | 25 |
| AA | 14 | 10 | 24 |
| HBA | 16 | 7 | 23 |
| NHIA | 14 | 7 | 21 |
| NHAA | 11 | 9 | 20 |
| NHTOM | 11 | 7 | 18 |
| HAAC | 4 | 2 | 6 |
| HAA | 3 | 1 | 4 |
| HNAC | 0 | 3 | 3 |
| NAC | 0 | 3 | 3 |
| NA | 0 | 2 | 2 |
| HNA | 0 | 2 | 2 |
| NHNA | 0 | 0 | 0 |
| NHNAC | 0 | 0 | 0 |
• Lubbock County population
59.4 mi,  269°
269°
• Garza County
42 mi,  224°
224°
• Floyd County
43.3 mi,  316°
316°
• Crosby County
29.4 mi, 269°
• Hall County
59.1 mi,  11°
11°
• Cottle County
44.1 mi,  41°
41°
• Stonewall County
43.1 mi,  134°
134°
• Motley County
30.6 mi,  359°
359°
• Kent County
29.8 mi,  178°
178°
• King County
31.2 mi,  90°
90°
[0] Calculated by population.us from last known population growth rate, not official data.
[1] County population - 2014, archived from the original, retrieved 02/23/2016
[1b] Annual County Resident Population Estimates by Age, Sex, Race, and Hispanic Origin, (used only data for 2014) archived from the original, retrieved 02/23/2016
[2] County population - 2000-2010, archived from the original, retrieved 02/23/2016
[3] Population of States and Counties of the United States: 1790 to 1992, PDF, 15 Mb, census.gov, retrieved 02/23/2016
[4] County area, latitude longitude data, retrieved 02/23/2016
[5] County boundaries, CSV files on boundaries.us, retrived 03/18/2016
Page generated in 0.022 seconds© 2016 population.us | Terms of use | Contact