Last official estimated population of Crosby County was 6,048 (year 2014)[1]. This was 0.002% of total US population and 0% of total Texas state population. Area of Crosby County is 901.7 mi² (=2335.4 km²), in this year population density was 6.71 p/mi². If population growth rate would be same as in period 2010-2014 (-0.05%/yr), Crosby County population in 2026 would be 6,015 [0].
Historical population of Crosby County for period 1880-2014 [1] , [2] , [3]:
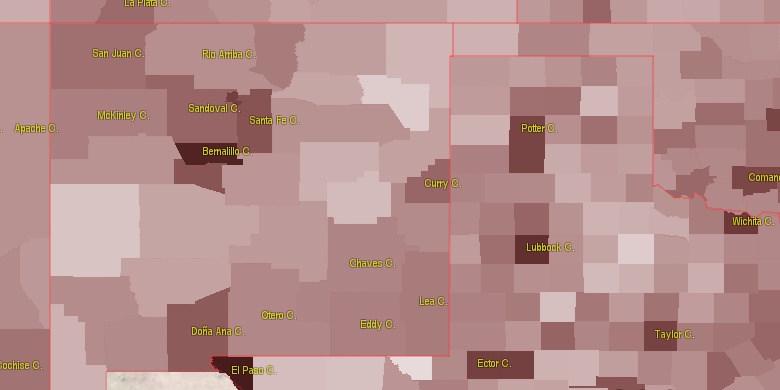
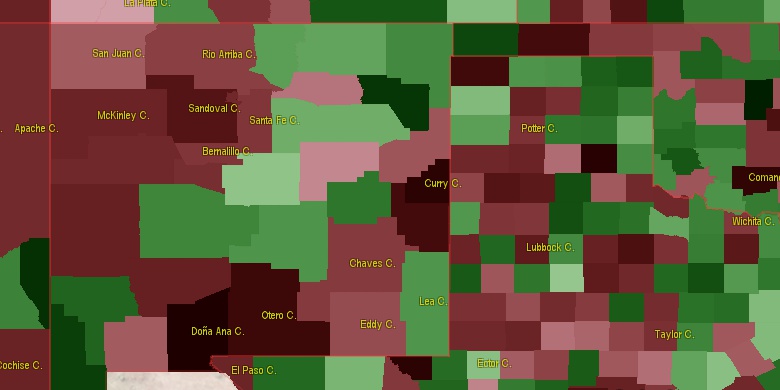
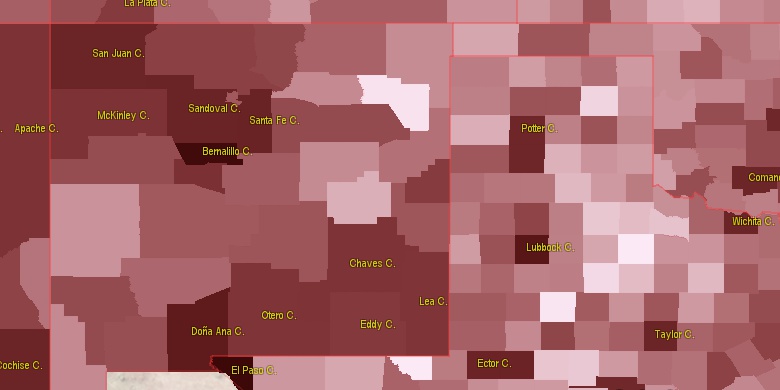
Estimated population for 2014[1]. Population density is in p./sq.mi [4]. Changes are for period 2010-2015. Value is %/year. Boundary lines are approx. 2012 [5]. Click on flag to hide it.
Population • Density • Changes • Legends • Position

[1880-1890] +15.49 %/yr
[1890-1900] +8.58 %/yr
[1900-1910] +8.4 %/yr
[1910-1920] +13.17 %/yr
[1920-1930] +6.12 %/yr
[1930-1940] -0.92 %/yr
[1940-1950] -0.47 %/yr
[1950-1960] +0.77 %/yr
[1960-1970] -1.29 %/yr
[1970-1980] -0.25 %/yr
[1980-1990] -1.91 %/yr
[1990-2000] -0.32 %/yr
[2000-2005] -1.61 %/yr
[2005-2010] -1.46 %/yr
[2010-2014] -0.05 %/yr
Looking for settlements in Crosby County? Visit this page: Settlements in Crosby County, TX
Population of Crosby County by age groups male (M) and female (F)[1b]
| Age Gr. | (M) | (F) | Total |
| 0 to 4 | 226 | 192 | 418 |
| 5 to 9 | 239 | 205 | 444 |
| 10 to 14 | 223 | 226 | 449 |
| 15 to 19 | 202 | 200 | 402 |
| 20 to 24 | 172 | 185 | 357 |
| 25 to 29 | 153 | 130 | 283 |
| 30 to 34 | 175 | 165 | 340 |
| 35 to 39 | 171 | 181 | 352 |
| 40 to 44 | 137 | 164 | 301 |
| 45 to 49 | 157 | 165 | 322 |
| 50 to 54 | 197 | 182 | 379 |
| 55 to 59 | 189 | 195 | 384 |
| 60 to 64 | 182 | 171 | 353 |
| 65 to 69 | 157 | 157 | 314 |
| 70 to 74 | 130 | 174 | 304 |
| 75 to 79 | 89 | 118 | 207 |
| 80 to 84 | 64 | 90 | 154 |
| 85+ | 48 | 88 | 136 |
Crosby County resident population estimates by Sex, Race, and Hispanic Origin[1b]. For full list of abbrevations see: population.us/about page.
| Race | Male | Female | Total |
| WAC | 2741 | 2818 | 5,559 |
| WA | 2694 | 2779 | 5,473 |
| H | 1604 | 1582 | 3,186 |
| HWAC | 1558 | 1539 | 3,097 |
| HWA | 1533 | 1516 | 3,049 |
| NH | 1307 | 1406 | 2,713 |
| NHWAC | 1183 | 1279 | 2,462 |
| NHWA | 1161 | 1263 | 2,424 |
| BAC | 153 | 148 | 301 |
| BA | 132 | 128 | 260 |
| NHBAC | 119 | 129 | 248 |
| NHBA | 110 | 117 | 227 |
| IAC | 55 | 49 | 104 |
| TOM | 49 | 40 | 89 |
| HIAC | 34 | 40 | 74 |
| IA | 31 | 37 | 68 |
| HBAC | 34 | 19 | 53 |
| HIA | 21 | 30 | 51 |
| HTOM | 26 | 23 | 49 |
| NHTOM | 23 | 17 | 40 |
| HBA | 22 | 11 | 33 |
| NHIAC | 21 | 9 | 30 |
| AAC | 7 | 12 | 19 |
| NHIA | 10 | 7 | 17 |
| NHAAC | 4 | 6 | 10 |
| HAAC | 3 | 6 | 9 |
| NAC | 5 | 3 | 8 |
| AA | 2 | 3 | 5 |
| NHNAC | 4 | 0 | 4 |
| NA | 3 | 1 | 4 |
| HNAC | 1 | 3 | 4 |
| NHAA | 1 | 2 | 3 |
| NHNA | 2 | 0 | 2 |
| HNA | 1 | 1 | 2 |
| HAA | 1 | 1 | 2 |
• Lubbock County population
30 mi,  270°
270°
• Hale County
43.7 mi,  316°
316°
• Hockley County
60.1 mi, 269°
• Garza County
29.4 mi,  180°
180°
• Floyd County
32.1 mi,  359°
359°
• Lynn County
42.2 mi,  225°
225°
• Dickens County
29.4 mi,  89°
89°
• Motley County
42.5 mi,  43°
43°
• Kent County
42.3 mi,  133°
133°
• King County
60.6 mi, 89°
[0] Calculated by population.us from last known population growth rate, not official data.
[1] County population - 2014, archived from the original, retrieved 02/23/2016
[1b] Annual County Resident Population Estimates by Age, Sex, Race, and Hispanic Origin, (used only data for 2014) archived from the original, retrieved 02/23/2016
[2] County population - 2000-2010, archived from the original, retrieved 02/23/2016
[3] Population of States and Counties of the United States: 1790 to 1992, PDF, 15 Mb, census.gov, retrieved 02/23/2016
[4] County area, latitude longitude data, retrieved 02/23/2016
[5] County boundaries, CSV files on boundaries.us, retrived 03/18/2016
Page generated in 0.021 seconds© 2016 population.us | Terms of use | Contact