Last official estimated population of Hale County was 36,355 (year 2014)[1]. This was 0.011% of total US population and 0.1% of total Texas state population. Area of Hale County is 1,004.8 mi² (=2602.4 km²), in this year population density was 36.18 p/mi². If population growth rate would be same as in period 2010-2014 (+0.06%/yr), Hale County population in 2026 would be 36,602 [0].
Historical population of Hale County for period 1890-2014 [1] , [2] , [3]:
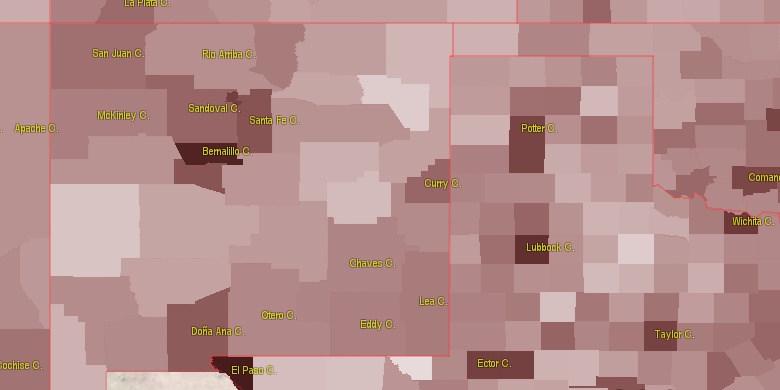
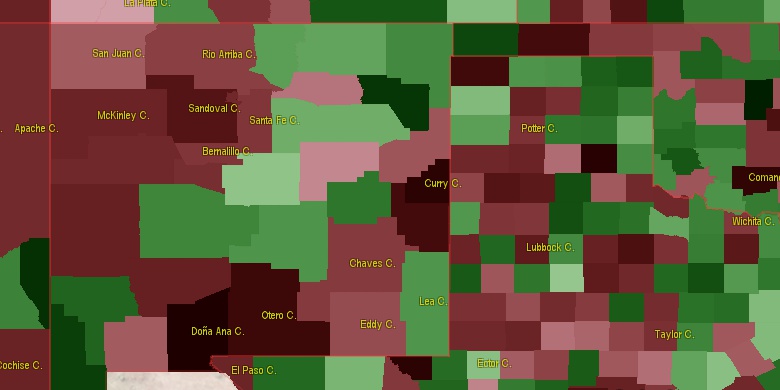
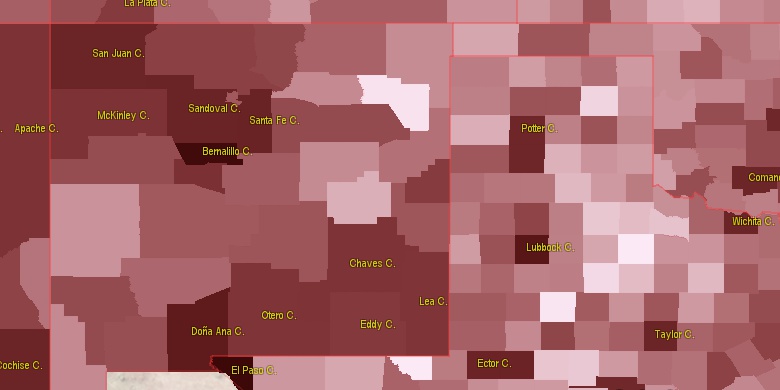
Estimated population for 2014[1]. Population density is in p./sq.mi [4]. Changes are for period 2010-2015. Value is %/year. Boundary lines are approx. 2012 [5]. Click on flag to hide it.
Population • Density • Changes • Legends • Position

[1890-1900] +8.83 %/yr
[1900-1910] +16.24 %/yr
[1910-1920] +2.93 %/yr
[1920-1930] +7.17 %/yr
[1930-1940] -0.7 %/yr
[1940-1950] +4.13 %/yr
[1950-1960] +2.69 %/yr
[1960-1970] -0.75 %/yr
[1970-1980] +0.97 %/yr
[1980-1990] -0.81 %/yr
[1990-2000] +0.54 %/yr
[2000-2005] -0.3 %/yr
[2005-2010] +0.11 %/yr
[2010-2014] +0.06 %/yr
Looking for settlements in Hale County? Visit this page: Settlements in Hale County, TX
Population of Hale County by age groups male (M) and female (F)[1b]
| Age Gr. | (M) | (F) | Total |
| 0 to 4 | 1341 | 1441 | 2,782 |
| 5 to 9 | 1360 | 1297 | 2,657 |
| 10 to 14 | 1362 | 1297 | 2,659 |
| 15 to 19 | 1409 | 1275 | 2,684 |
| 20 to 24 | 1655 | 1249 | 2,904 |
| 25 to 29 | 1433 | 1050 | 2,483 |
| 30 to 34 | 1266 | 1017 | 2,283 |
| 35 to 39 | 1078 | 901 | 1,979 |
| 40 to 44 | 1062 | 975 | 2,037 |
| 45 to 49 | 1103 | 947 | 2,050 |
| 50 to 54 | 1107 | 1019 | 2,126 |
| 55 to 59 | 980 | 1013 | 1,993 |
| 60 to 64 | 816 | 764 | 1,580 |
| 65 to 69 | 633 | 667 | 1,300 |
| 70 to 74 | 516 | 600 | 1,116 |
| 75 to 79 | 361 | 444 | 805 |
| 80 to 84 | 296 | 377 | 673 |
| 85+ | 238 | 371 | 609 |
Hale County resident population estimates by Sex, Race, and Hispanic Origin[1b]. For full list of abbrevations see: population.us/about page.
| Race | Male | Female | Total |
| WAC | 16317 | 15498 | 31,815 |
| WA | 16117 | 15320 | 31,437 |
| H | 10433 | 9779 | 20,212 |
| HWAC | 10009 | 9334 | 19,343 |
| HWA | 9935 | 9271 | 19,206 |
| NH | 7583 | 6925 | 14,508 |
| NHWAC | 6308 | 6164 | 12,472 |
| NHWA | 6182 | 6049 | 12,231 |
| BAC | 1350 | 884 | 2,234 |
| BA | 1251 | 786 | 2,037 |
| NHBAC | 1168 | 668 | 1,836 |
| NHBA | 1103 | 602 | 1,705 |
| IAC | 372 | 374 | 746 |
| IA | 275 | 301 | 576 |
| HIAC | 264 | 262 | 526 |
| HIA | 220 | 233 | 453 |
| TOM | 220 | 193 | 413 |
| HBAC | 182 | 216 | 398 |
| HBA | 148 | 184 | 332 |
| AAC | 163 | 118 | 281 |
| NHTOM | 138 | 127 | 265 |
| NHIAC | 108 | 112 | 220 |
| NHAAC | 121 | 93 | 214 |
| AA | 126 | 86 | 212 |
| NHAA | 94 | 69 | 163 |
| HTOM | 82 | 66 | 148 |
| NHIA | 55 | 68 | 123 |
| NAC | 42 | 33 | 75 |
| HAAC | 42 | 25 | 67 |
| HAA | 32 | 17 | 49 |
| NA | 27 | 18 | 45 |
| NHNAC | 20 | 19 | 39 |
| HNAC | 22 | 14 | 36 |
| HNA | 16 | 8 | 24 |
| NHNA | 11 | 10 | 21 |
• Lubbock County population
31.6 mi,  179°
179°
• Hockley County
43.7 mi,  223°
223°
• Lamb County
30.1 mi,  270°
270°
• Castro County
40.6 mi,  322°
322°
• Swisher County
32 mi,  8°
8°
• Bailey County
57.7 mi, 269°
• Floyd County
29.7 mi,  89°
89°
• Crosby County
43.7 mi,  136°
136°
• Briscoe County
47.3 mi,  48°
48°
• Motley County
58.9 mi, 90°
[0] Calculated by population.us from last known population growth rate, not official data.
[1] County population - 2014, archived from the original, retrieved 02/23/2016
[1b] Annual County Resident Population Estimates by Age, Sex, Race, and Hispanic Origin, (used only data for 2014) archived from the original, retrieved 02/23/2016
[2] County population - 2000-2010, archived from the original, retrieved 02/23/2016
[3] Population of States and Counties of the United States: 1790 to 1992, PDF, 15 Mb, census.gov, retrieved 02/23/2016
[4] County area, latitude longitude data, retrieved 02/23/2016
[5] County boundaries, CSV files on boundaries.us, retrived 03/18/2016
Page generated in 0.013 seconds© 2016 population.us | Terms of use | Contact