Last official estimated population of Hudspeth County was 3,462 (year 2014)[1]. This was 0.001% of total US population and 0% of total Texas state population. Area of Hudspeth County is 4,571.7 mi² (=11840.6 km²), in this year population density was 0.76 p/mi². If population growth rate would be same as in period 2010-2014 (-0.1%/yr), Hudspeth County population in 2026 would be 3,420 [0].
Historical population of Hudspeth County for period 1920-2014 [1] , [2] , [3]:
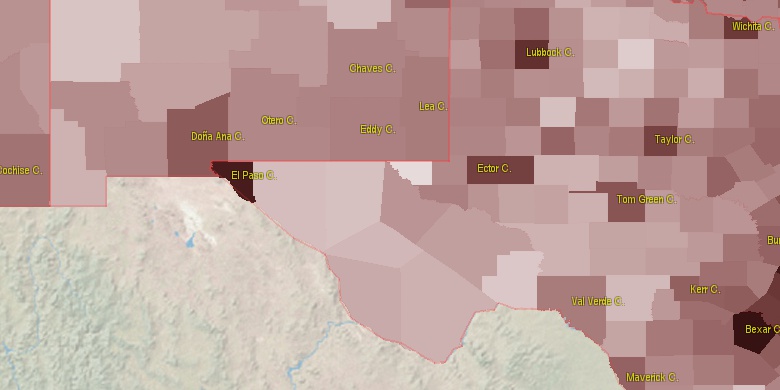
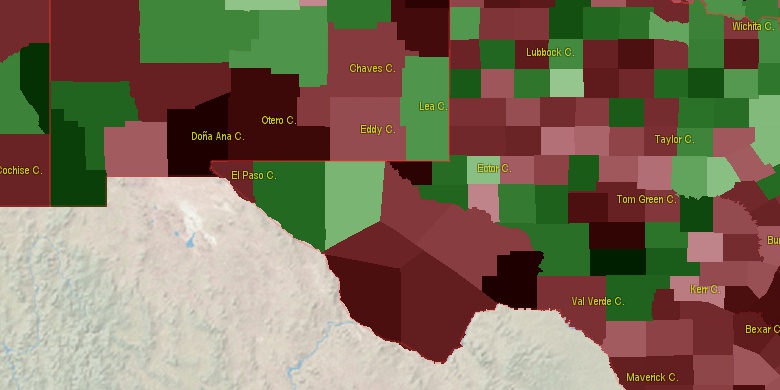
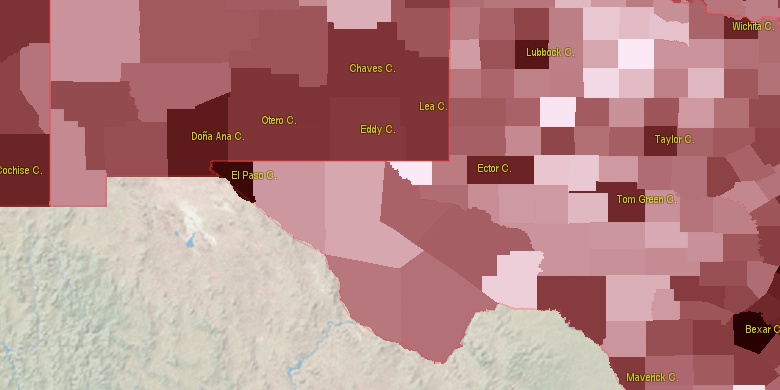
Estimated population for 2014[1]. Population density is in p./sq.mi [4]. Changes are for period 2010-2015. Value is %/year. Boundary lines are approx. 2012 [5]. Click on flag to hide it.
Population • Density • Changes • Legends • Position

[1920-1930] +14.51 %/yr
[1930-1940] -1.67 %/yr
[1940-1950] +3.16 %/yr
[1950-1960] -2.48 %/yr
[1960-1970] -3.29 %/yr
[1970-1980] +1.32 %/yr
[1980-1990] +0.67 %/yr
[1990-2000] +1.4 %/yr
[2000-2005] +0.4 %/yr
[2005-2010] +0.35 %/yr
[2010-2014] -0.1 %/yr
Looking for settlements in Hudspeth County? Visit this page: Settlements in Hudspeth County, TX
Population of Hudspeth County by age groups male (M) and female (F)[1b]
| Age Gr. | (M) | (F) | Total |
| 0 to 4 | 95 | 112 | 207 |
| 5 to 9 | 99 | 96 | 195 |
| 10 to 14 | 114 | 122 | 236 |
| 15 to 19 | 128 | 127 | 255 |
| 20 to 24 | 115 | 104 | 219 |
| 25 to 29 | 77 | 79 | 156 |
| 30 to 34 | 106 | 64 | 170 |
| 35 to 39 | 69 | 83 | 152 |
| 40 to 44 | 108 | 87 | 195 |
| 45 to 49 | 93 | 93 | 186 |
| 50 to 54 | 118 | 118 | 236 |
| 55 to 59 | 117 | 130 | 247 |
| 60 to 64 | 102 | 103 | 205 |
| 65 to 69 | 109 | 84 | 193 |
| 70 to 74 | 88 | 72 | 160 |
| 75 to 79 | 40 | 43 | 83 |
| 80 to 84 | 23 | 38 | 61 |
| 85+ | 26 | 29 | 55 |
Hudspeth County resident population estimates by Sex, Race, and Hispanic Origin[1b]. For full list of abbrevations see: population.us/about page.
| Race | Male | Female | Total |
| WAC | 1555 | 1519 | 3,074 |
| WA | 1536 | 1496 | 3,032 |
| H | 1250 | 1260 | 2,510 |
| HWAC | 1213 | 1225 | 2,438 |
| HWA | 1204 | 1214 | 2,418 |
| NH | 377 | 324 | 701 |
| NHWAC | 342 | 294 | 636 |
| NHWA | 332 | 282 | 614 |
| BAC | 39 | 37 | 76 |
| IAC | 32 | 33 | 65 |
| BA | 32 | 25 | 57 |
| IA | 23 | 21 | 44 |
| NHBAC | 26 | 17 | 43 |
| TOM | 19 | 24 | 43 |
| HIAC | 24 | 18 | 42 |
| AAC | 20 | 18 | 38 |
| AA | 17 | 18 | 35 |
| NHBA | 22 | 11 | 33 |
| HBAC | 13 | 20 | 33 |
| HIA | 19 | 13 | 32 |
| HBA | 10 | 14 | 24 |
| NHTOM | 10 | 13 | 23 |
| NHIAC | 8 | 15 | 23 |
| NHAAC | 11 | 10 | 21 |
| HTOM | 9 | 11 | 20 |
| NHAA | 9 | 10 | 19 |
| HAAC | 9 | 8 | 17 |
| HAA | 8 | 8 | 16 |
| NHIA | 4 | 8 | 12 |
| NHNAC | 0 | 1 | 1 |
| NAC | 0 | 1 | 1 |
| HNAC | 0 | 0 | 0 |
| HNA | 0 | 0 | 0 |
| NA | 0 | 0 | 0 |
| NHNA | 0 | 0 | 0 |
• El Paso County population
55.3 mi,  293°
293°
• Doña Ana County
105.6 mi,  306°
306°
• Otero County
82.1 mi,  343°
343°
• Eddy County
93.7 mi,  42°
42°
• Reeves County
98.7 mi,  95°
95°
• Ward County
134 mi,  88°
88°
• Presidio County
119.8 mi,  146°
146°
• Culberson County
50.1 mi, 90°
• Jeff Davis County
90.6 mi,  129°
129°
• Loving County
110.2 mi,  75°
75°
[0] Calculated by population.us from last known population growth rate, not official data.
[1] County population - 2014, archived from the original, retrieved 02/23/2016
[1b] Annual County Resident Population Estimates by Age, Sex, Race, and Hispanic Origin, (used only data for 2014) archived from the original, retrieved 02/23/2016
[2] County population - 2000-2010, archived from the original, retrieved 02/23/2016
[3] Population of States and Counties of the United States: 1790 to 1992, PDF, 15 Mb, census.gov, retrieved 02/23/2016
[4] County area, latitude longitude data, retrieved 02/23/2016
[5] County boundaries, CSV files on boundaries.us, retrived 03/18/2016
*El Paso Texas Notes
Page generated in 0.022 seconds© 2016 population.us | Terms of use | Contact