Last official estimated population of Hutchinson County was 22,212 (year 2014)[1]. This was 0.007% of total US population and 0.1% of total Texas state population. Area of Hutchinson County is 895.0 mi² (=2317.9 km²), in this year population density was 24.82 p/mi². If population growth rate would be same as in period 2010-2014 (+0.07%/yr), Hutchinson County population in 2026 would be 22,399 [0].
Historical population of Hutchinson County for period 1880-2014 [1] , [2] , [3]:
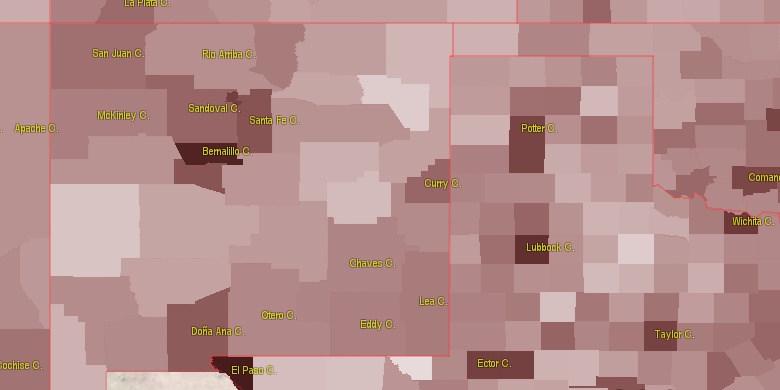
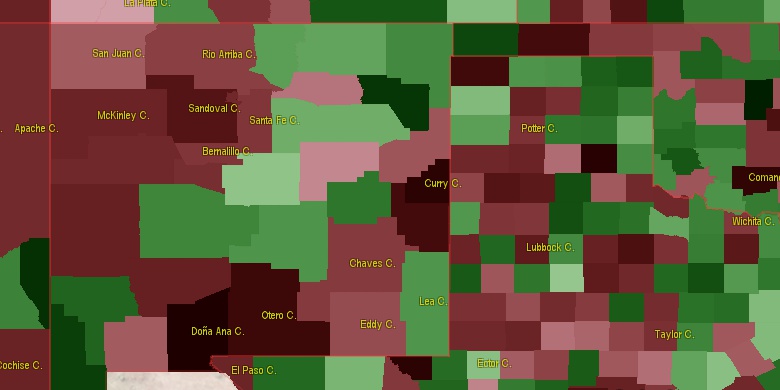
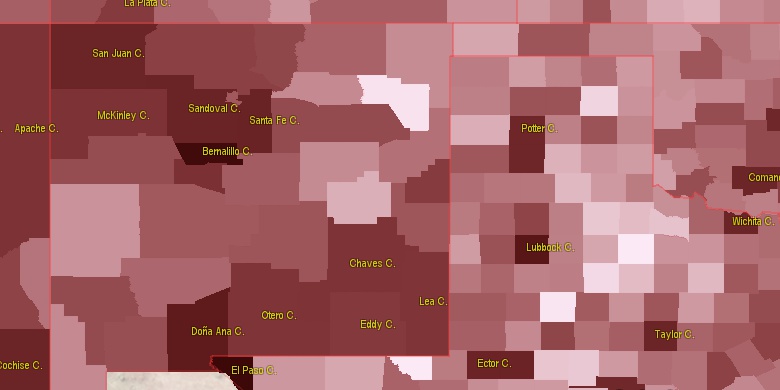
Estimated population for 2014[1]. Population density is in p./sq.mi [4]. Changes are for period 2010-2015. Value is %/year. Boundary lines are approx. 2012 [5]. Click on flag to hide it.
Population • Density • Changes • Legends • Position

[1880-1890] +1.5 %/yr
[1890-1900] +17.98 %/yr
[1900-1910] +11.4 %/yr
[1910-1920] -2.11 %/yr
[1920-1930] +35.32 %/yr
[1930-1940] +2.53 %/yr
[1940-1950] +5.17 %/yr
[1950-1960] +0.86 %/yr
[1960-1970] -3.36 %/yr
[1970-1980] +0.74 %/yr
[1980-1990] -0.24 %/yr
[1990-2000] -0.73 %/yr
[2000-2005] -1.43 %/yr
[2005-2010] -0.05 %/yr
[2010-2014] +0.07 %/yr
Looking for settlements in Hutchinson County? Visit this page: Settlements in Hutchinson County, TX
Population of Hutchinson County by age groups male (M) and female (F)[1b]
| Age Gr. | (M) | (F) | Total |
| 0 to 4 | 774 | 808 | 1,582 |
| 5 to 9 | 782 | 807 | 1,589 |
| 10 to 14 | 821 | 786 | 1,607 |
| 15 to 19 | 745 | 753 | 1,498 |
| 20 to 24 | 680 | 625 | 1,305 |
| 25 to 29 | 631 | 622 | 1,253 |
| 30 to 34 | 728 | 680 | 1,408 |
| 35 to 39 | 685 | 686 | 1,371 |
| 40 to 44 | 633 | 679 | 1,312 |
| 45 to 49 | 599 | 550 | 1,149 |
| 50 to 54 | 767 | 730 | 1,497 |
| 55 to 59 | 813 | 773 | 1,586 |
| 60 to 64 | 718 | 695 | 1,413 |
| 65 to 69 | 499 | 493 | 992 |
| 70 to 74 | 370 | 367 | 737 |
| 75 to 79 | 270 | 323 | 593 |
| 80 to 84 | 198 | 281 | 479 |
| 85+ | 175 | 227 | 402 |
Hutchinson County resident population estimates by Sex, Race, and Hispanic Origin[1b]. For full list of abbrevations see: population.us/about page.
| Race | Male | Female | Total |
| WAC | 10256 | 10252 | 20,508 |
| WA | 10030 | 10010 | 20,040 |
| NH | 8426 | 8486 | 16,912 |
| NHWAC | 7919 | 7999 | 15,918 |
| NHWA | 7752 | 7797 | 15,549 |
| H | 2462 | 2399 | 4,861 |
| HWAC | 2337 | 2253 | 4,590 |
| HWA | 2278 | 2213 | 4,491 |
| BAC | 426 | 416 | 842 |
| NHBAC | 360 | 356 | 716 |
| IAC | 350 | 364 | 714 |
| BA | 342 | 301 | 643 |
| NHBA | 293 | 254 | 547 |
| NHIAC | 245 | 251 | 496 |
| TOM | 238 | 250 | 488 |
| IA | 210 | 238 | 448 |
| NHTOM | 177 | 208 | 385 |
| NHIA | 149 | 153 | 302 |
| HIAC | 105 | 113 | 218 |
| AAC | 86 | 98 | 184 |
| NHAAC | 77 | 90 | 167 |
| HIA | 61 | 85 | 146 |
| AA | 57 | 78 | 135 |
| HBAC | 66 | 60 | 126 |
| NHAA | 53 | 72 | 125 |
| HTOM | 61 | 42 | 103 |
| HBA | 49 | 47 | 96 |
| NAC | 17 | 13 | 30 |
| NA | 11 | 8 | 19 |
| HNAC | 10 | 7 | 17 |
| HAAC | 9 | 8 | 17 |
| HNA | 9 | 6 | 15 |
| NHNAC | 7 | 6 | 13 |
| HAA | 4 | 6 | 10 |
| NHNA | 2 | 2 | 4 |
• Potter County population
42.5 mi,  224°
224°
• Gray County
43.1 mi,  134°
134°
• Moore County
29.6 mi,  269°
269°
• Ochiltree County
43.2 mi,  45°
45°
• Carson County
29.8 mi,  179°
179°
• Hansford County
30.1 mi,  0°
0°
• Hemphill County
60.7 mi,  91°
91°
• Sherman County
42.8 mi,  315°
315°
• Armstrong County
60.3 mi, 179°
• Roberts County
31.1 mi, 90°
[0] Calculated by population.us from last known population growth rate, not official data.
[1] County population - 2014, archived from the original, retrieved 02/23/2016
[1b] Annual County Resident Population Estimates by Age, Sex, Race, and Hispanic Origin, (used only data for 2014) archived from the original, retrieved 02/23/2016
[2] County population - 2000-2010, archived from the original, retrieved 02/23/2016
[3] Population of States and Counties of the United States: 1790 to 1992, PDF, 15 Mb, census.gov, retrieved 02/23/2016
[4] County area, latitude longitude data, retrieved 02/23/2016
[5] County boundaries, CSV files on boundaries.us, retrived 03/18/2016
Page generated in 0.016 seconds© 2016 population.us | Terms of use | Contact