Last official estimated population of Moore County was 21,996 (year 2014)[1]. This was 0.007% of total US population and 0.1% of total Texas state population. Area of Moore County is 909.6 mi² (=2355.9 km²), in this year population density was 24.18 p/mi². If population growth rate would be same as in period 2010-2014 (+0.1%/yr), Moore County population in 2026 would be 22,274 [0].
Historical population of Moore County for period 1890-2014 [1] , [2] , [3]:
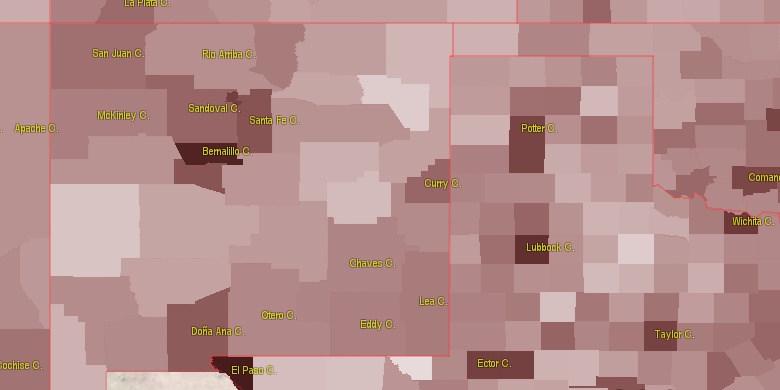
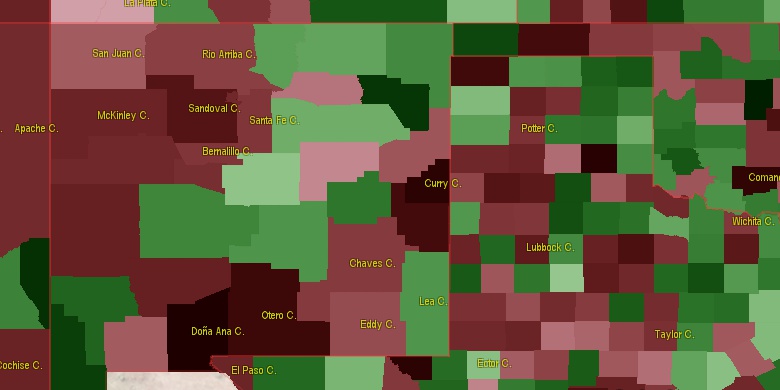
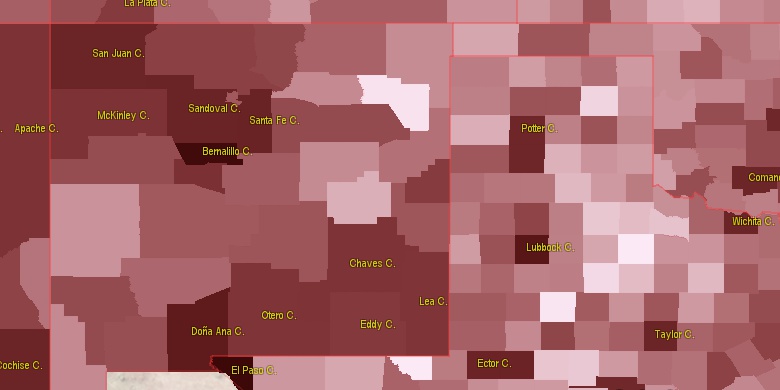
Estimated population for 2014[1]. Population density is in p./sq.mi [4]. Changes are for period 2010-2015. Value is %/year. Boundary lines are approx. 2012 [5]. Click on flag to hide it.
Population • Density • Changes • Legends • Position

[1890-1900] +30.14 %/yr
[1900-1910] +10.38 %/yr
[1910-1920] +0.18 %/yr
[1920-1930] +10.54 %/yr
[1930-1940] +11.11 %/yr
[1940-1950] +11.58 %/yr
[1950-1960] +1.02 %/yr
[1960-1970] -0.49 %/yr
[1970-1980] +1.66 %/yr
[1980-1990] +0.75 %/yr
[1990-2000] +1.2 %/yr
[2000-2005] +0.19 %/yr
[2005-2010] +1.52 %/yr
[2010-2014] +0.1 %/yr
Looking for settlements in Moore County? Visit this page: Settlements in Moore County, TX
Population of Moore County by age groups male (M) and female (F)[1b]
| Age Gr. | (M) | (F) | Total |
| 0 to 4 | 1073 | 1033 | 2,106 |
| 5 to 9 | 1024 | 947 | 1,971 |
| 10 to 14 | 962 | 845 | 1,807 |
| 15 to 19 | 918 | 769 | 1,687 |
| 20 to 24 | 905 | 762 | 1,667 |
| 25 to 29 | 845 | 644 | 1,489 |
| 30 to 34 | 820 | 755 | 1,575 |
| 35 to 39 | 747 | 678 | 1,425 |
| 40 to 44 | 691 | 570 | 1,261 |
| 45 to 49 | 682 | 607 | 1,289 |
| 50 to 54 | 675 | 644 | 1,319 |
| 55 to 59 | 633 | 648 | 1,281 |
| 60 to 64 | 522 | 492 | 1,014 |
| 65 to 69 | 349 | 366 | 715 |
| 70 to 74 | 251 | 311 | 562 |
| 75 to 79 | 184 | 227 | 411 |
| 80 to 84 | 162 | 161 | 323 |
| 85+ | 96 | 150 | 246 |
Moore County resident population estimates by Sex, Race, and Hispanic Origin[1b]. For full list of abbrevations see: population.us/about page.
| Race | Male | Female | Total |
| WAC | 9738 | 9429 | 19,167 |
| WA | 9622 | 9314 | 18,936 |
| H | 6124 | 5570 | 11,694 |
| HWAC | 5880 | 5397 | 11,277 |
| HWA | 5848 | 5363 | 11,211 |
| NH | 5415 | 5039 | 10,454 |
| NHWAC | 3858 | 4032 | 7,890 |
| NHWA | 3774 | 3951 | 7,725 |
| AAC | 1115 | 847 | 1,962 |
| AA | 1088 | 819 | 1,907 |
| NHAAC | 1081 | 821 | 1,902 |
| NHAA | 1062 | 798 | 1,860 |
| BAC | 527 | 231 | 758 |
| BA | 479 | 189 | 668 |
| NHBAC | 437 | 168 | 605 |
| NHBA | 401 | 143 | 544 |
| IAC | 253 | 214 | 467 |
| IA | 189 | 149 | 338 |
| HIAC | 151 | 118 | 269 |
| TOM | 131 | 127 | 258 |
| HIA | 129 | 96 | 225 |
| NHIAC | 102 | 96 | 198 |
| NHTOM | 93 | 89 | 182 |
| HBAC | 90 | 63 | 153 |
| HBA | 78 | 46 | 124 |
| NHIA | 60 | 53 | 113 |
| HTOM | 38 | 38 | 76 |
| HAAC | 34 | 26 | 60 |
| NAC | 37 | 19 | 56 |
| HAA | 26 | 21 | 47 |
| NHNAC | 30 | 12 | 42 |
| NA | 30 | 11 | 41 |
| NHNA | 25 | 5 | 30 |
| HNAC | 7 | 7 | 14 |
| HNA | 5 | 6 | 11 |
• Potter County population
30.2 mi,  180°
180°
• Randall County
60.3 mi, 180°
• Hutchinson County
29.6 mi,  89°
89°
• Dallam County
50.1 mi,  308°
308°
• Carson County
42.3 mi,  134°
134°
• Hartley County
40.3 mi,  270°
270°
• Hansford County
42.4 mi,  44°
44°
• Sherman County
30.6 mi,  359°
359°
• Oldham County
49.8 mi,  232°
232°
• Roberts County
60.7 mi, 89°
[0] Calculated by population.us from last known population growth rate, not official data.
[1] County population - 2014, archived from the original, retrieved 02/23/2016
[1b] Annual County Resident Population Estimates by Age, Sex, Race, and Hispanic Origin, (used only data for 2014) archived from the original, retrieved 02/23/2016
[2] County population - 2000-2010, archived from the original, retrieved 02/23/2016
[3] Population of States and Counties of the United States: 1790 to 1992, PDF, 15 Mb, census.gov, retrieved 02/23/2016
[4] County area, latitude longitude data, retrieved 02/23/2016
[5] County boundaries, CSV files on boundaries.us, retrived 03/18/2016
Page generated in 0.016 seconds© 2016 population.us | Terms of use | Contact