Last official estimated population of Marion County was 10,513 (year 2014)[1]. This was 0.003% of total US population and 0% of total Texas state population. Area of Marion County is 420.3 mi² (=1088.6 km²), in this year population density was 25.01 p/mi². If population growth rate would be same as in period 2010-2014 (-0.08%/yr), Marion County population in 2026 would be 10,415 [0].
Historical population of Marion County for period 1860-2014 [1] , [2] , [3]:
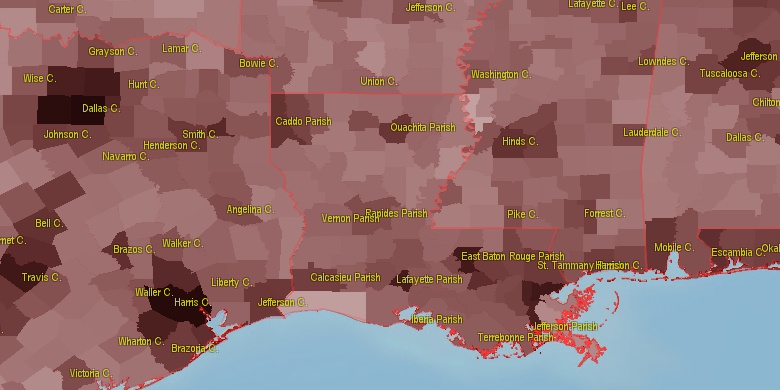
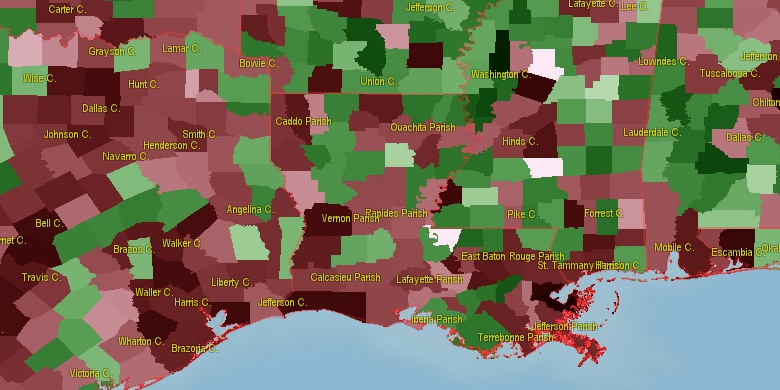
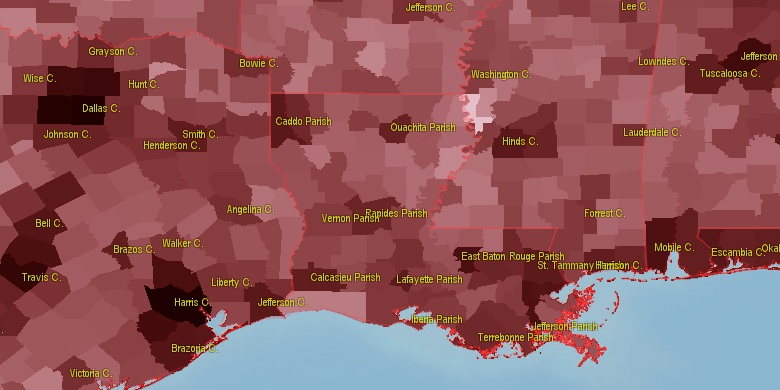
Estimated population for 2014[1]. Population density is in p./sq.mi [4]. Changes are for period 2010-2015. Value is %/year. Boundary lines are approx. 2012 [5]. Click on flag to hide it.
Population • Density • Changes • Legends • Position

[1860-1870] +7.97 %/yr
[1870-1880] +2.52 %/yr
[1880-1890] -0.11 %/yr
[1890-1900] -0.1 %/yr
[1900-1910] -0.27 %/yr
[1910-1920] +0.39 %/yr
[1920-1930] -0.48 %/yr
[1930-1940] +1 %/yr
[1940-1950] -1.18 %/yr
[1950-1960] -2.31 %/yr
[1960-1970] +0.57 %/yr
[1970-1980] +1.98 %/yr
[1980-1990] -0.37 %/yr
[1990-2000] +0.92 %/yr
[2000-2005] +0.07 %/yr
[2005-2010] -0.8 %/yr
[2010-2014] -0.08 %/yr
Looking for settlements in Marion County? Visit this page: Settlements in Marion County, TX
Population of Marion County by age groups male (M) and female (F)[1b]
| Age Gr. | (M) | (F) | Total |
| 0 to 4 | 233 | 226 | 459 |
| 5 to 9 | 263 | 259 | 522 |
| 10 to 14 | 275 | 261 | 536 |
| 15 to 19 | 315 | 235 | 550 |
| 20 to 24 | 276 | 207 | 483 |
| 25 to 29 | 211 | 247 | 458 |
| 30 to 34 | 229 | 272 | 501 |
| 35 to 39 | 220 | 240 | 460 |
| 40 to 44 | 247 | 292 | 539 |
| 45 to 49 | 300 | 354 | 654 |
| 50 to 54 | 416 | 437 | 853 |
| 55 to 59 | 466 | 441 | 907 |
| 60 to 64 | 392 | 441 | 833 |
| 65 to 69 | 395 | 440 | 835 |
| 70 to 74 | 285 | 310 | 595 |
| 75 to 79 | 220 | 241 | 461 |
| 80 to 84 | 130 | 140 | 270 |
| 85+ | 89 | 144 | 233 |
Marion County resident population estimates by Sex, Race, and Hispanic Origin[1b]. For full list of abbrevations see: population.us/about page.
| Race | Male | Female | Total |
| NH | 4755 | 4981 | 9,736 |
| WAC | 3842 | 3847 | 7,689 |
| WA | 3741 | 3762 | 7,503 |
| NHWAC | 3680 | 3670 | 7,350 |
| NHWA | 3585 | 3592 | 7,177 |
| BAC | 1061 | 1279 | 2,340 |
| NHBAC | 1035 | 1264 | 2,299 |
| BA | 1016 | 1240 | 2,256 |
| NHBA | 992 | 1229 | 2,221 |
| H | 207 | 206 | 413 |
| HWAC | 162 | 177 | 339 |
| HWA | 156 | 170 | 326 |
| IAC | 108 | 112 | 220 |
| TOM | 108 | 93 | 201 |
| NHTOM | 100 | 86 | 186 |
| NHIAC | 85 | 90 | 175 |
| IA | 53 | 62 | 115 |
| AAC | 61 | 37 | 98 |
| NHAAC | 58 | 37 | 95 |
| NHIA | 35 | 44 | 79 |
| AA | 43 | 28 | 71 |
| NHAA | 42 | 28 | 70 |
| HIAC | 23 | 22 | 45 |
| HBAC | 26 | 15 | 41 |
| HIA | 18 | 18 | 36 |
| HBA | 24 | 11 | 35 |
| HTOM | 8 | 7 | 15 |
| NAC | 4 | 8 | 12 |
| NHNAC | 3 | 8 | 11 |
| HAAC | 3 | 0 | 3 |
| NHNA | 1 | 2 | 3 |
| NA | 1 | 2 | 3 |
| HNAC | 1 | 0 | 1 |
| HAA | 1 | 0 | 1 |
| HNA | 0 | 0 | 0 |
• Caddo Parish population
31.5 mi,  118°
118°
• Gregg County
34.3 mi,  231°
231°
• Bossier Parish
43.6 mi,  99°
99°
• Harrison County
17.3 mi,  183°
183°
• Miller County
43.9 mi,  36°
36°
• Upshur County
34.2 mi,  262°
262°
• Cass County
19.7 mi,  359°
359°
• Panola County
43.9 mi, 176°
• Morris County
30.9 mi,  315°
315°
• Camp County
38.1 mi,  288°
288°
[0] Calculated by population.us from last known population growth rate, not official data.
[1] County population - 2014, archived from the original, retrieved 02/23/2016
[1b] Annual County Resident Population Estimates by Age, Sex, Race, and Hispanic Origin, (used only data for 2014) archived from the original, retrieved 02/23/2016
[2] County population - 2000-2010, archived from the original, retrieved 02/23/2016
[3] Population of States and Counties of the United States: 1790 to 1992, PDF, 15 Mb, census.gov, retrieved 02/23/2016
[4] County area, latitude longitude data, retrieved 02/23/2016
[5] County boundaries, CSV files on boundaries.us, retrived 03/18/2016
*Cass Texas Notes
Page generated in 0.02 seconds© 2016 population.us | Terms of use | Contact