Last official estimated population of Panola County was 23,781 (year 2014)[1]. This was 0.007% of total US population and 0.1% of total Texas state population. Area of Panola County is 821.3 mi² (=2127.2 km²), in this year population density was 28.95 p/mi². If population growth rate would be same as in period 2010-2014 (-0.02%/yr), Panola County population in 2026 would be 23,736 [0].
Historical population of Panola County for period 1850-2014 [1] , [2] , [3]:
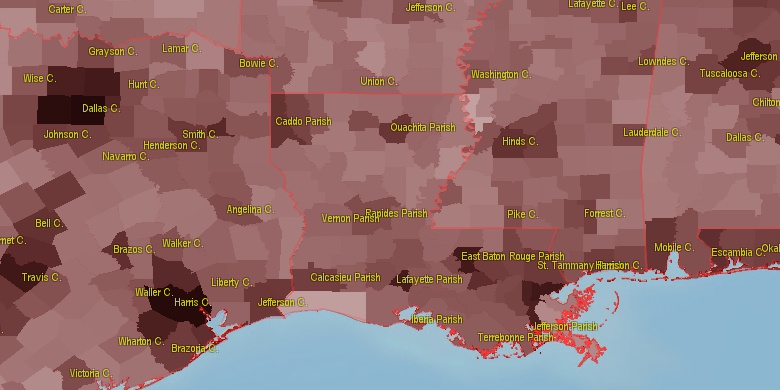
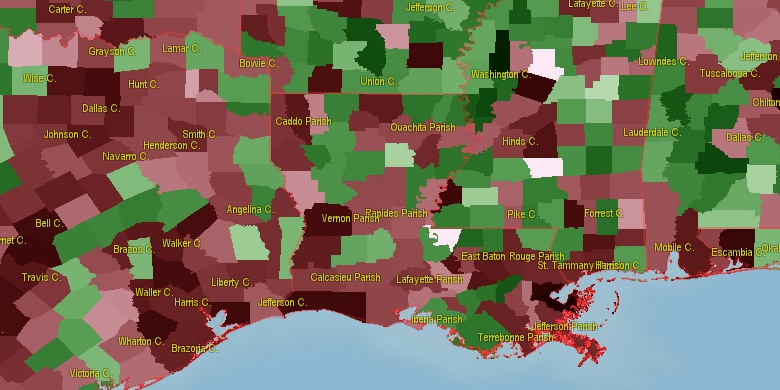
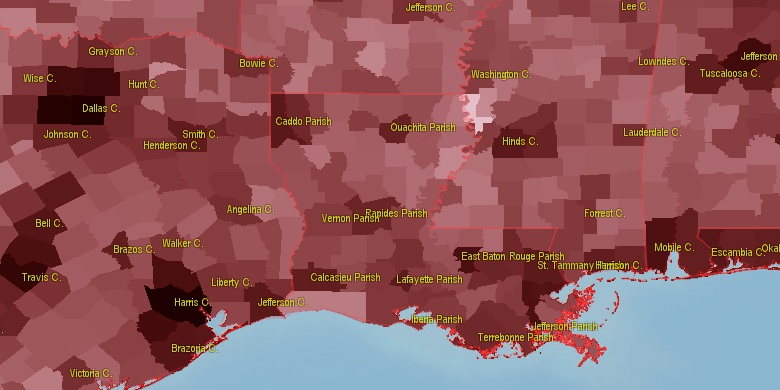
Estimated population for 2014[1]. Population density is in p./sq.mi [4]. Changes are for period 2010-2015. Value is %/year. Boundary lines are approx. 2012 [5]. Click on flag to hide it.
Population • Density • Changes • Legends • Position

[1850-1860] +8.15 %/yr
[1860-1870] +1.79 %/yr
[1870-1880] +1.9 %/yr
[1880-1890] +1.6 %/yr
[1890-1900] +4.1 %/yr
[1900-1910] -0.47 %/yr
[1910-1920] +0.63 %/yr
[1920-1930] +1.01 %/yr
[1930-1940] -0.66 %/yr
[1940-1950] -1.55 %/yr
[1950-1960] -1.31 %/yr
[1960-1970] -0.59 %/yr
[1970-1980] +2.69 %/yr
[1980-1990] +0.62 %/yr
[1990-2000] +0.32 %/yr
[2000-2005] +0.33 %/yr
[2005-2010] +0.56 %/yr
[2010-2014] -0.02 %/yr
Looking for settlements in Panola County? Visit this page: Settlements in Panola County, TX
Population of Panola County by age groups male (M) and female (F)[1b]
| Age Gr. | (M) | (F) | Total |
| 0 to 4 | 765 | 759 | 1,524 |
| 5 to 9 | 863 | 757 | 1,620 |
| 10 to 14 | 871 | 763 | 1,634 |
| 15 to 19 | 777 | 816 | 1,593 |
| 20 to 24 | 783 | 697 | 1,480 |
| 25 to 29 | 696 | 647 | 1,343 |
| 30 to 34 | 757 | 726 | 1,483 |
| 35 to 39 | 677 | 730 | 1,407 |
| 40 to 44 | 683 | 683 | 1,366 |
| 45 to 49 | 604 | 680 | 1,284 |
| 50 to 54 | 830 | 837 | 1,667 |
| 55 to 59 | 823 | 883 | 1,706 |
| 60 to 64 | 816 | 818 | 1,634 |
| 65 to 69 | 634 | 650 | 1,284 |
| 70 to 74 | 458 | 545 | 1,003 |
| 75 to 79 | 354 | 430 | 784 |
| 80 to 84 | 229 | 325 | 554 |
| 85+ | 150 | 253 | 403 |
Panola County resident population estimates by Sex, Race, and Hispanic Origin[1b]. For full list of abbrevations see: population.us/about page.
| Race | Male | Female | Total |
| NH | 10605 | 11000 | 21,605 |
| WAC | 9793 | 9853 | 19,646 |
| WA | 9575 | 9687 | 19,262 |
| NHWAC | 8710 | 8915 | 17,625 |
| NHWA | 8564 | 8806 | 17,370 |
| BAC | 1915 | 2056 | 3,971 |
| NHBAC | 1854 | 2012 | 3,866 |
| BA | 1826 | 1988 | 3,814 |
| NHBA | 1789 | 1965 | 3,754 |
| H | 1165 | 999 | 2,164 |
| HWAC | 1083 | 938 | 2,021 |
| HWA | 1011 | 881 | 1,892 |
| TOM | 233 | 181 | 414 |
| IAC | 203 | 165 | 368 |
| NHTOM | 156 | 119 | 275 |
| NHIAC | 121 | 101 | 222 |
| AAC | 78 | 92 | 170 |
| IA | 78 | 73 | 151 |
| NHAAC | 70 | 80 | 150 |
| HIAC | 82 | 64 | 146 |
| HTOM | 77 | 62 | 139 |
| AA | 51 | 63 | 114 |
| NHAA | 49 | 59 | 108 |
| HBAC | 61 | 44 | 105 |
| NHIA | 45 | 47 | 92 |
| HBA | 37 | 23 | 60 |
| HIA | 33 | 26 | 59 |
| NAC | 20 | 19 | 39 |
| NHNAC | 10 | 12 | 22 |
| HAAC | 8 | 12 | 20 |
| HNAC | 10 | 7 | 17 |
| NA | 7 | 7 | 14 |
| HNA | 5 | 3 | 8 |
| NHNA | 2 | 4 | 6 |
| HAA | 2 | 4 | 6 |
• Caddo Parish population
37.7 mi,  40°
40°
• Gregg County
37.2 mi,  306°
306°
• Bossier Parish
54.4 mi,  47°
47°
• Harrison County
26.8 mi,  351°
351°
• Nacogdoches County
41.8 mi,  206°
206°
• Rusk County
26.7 mi,  261°
261°
• Upshur County
54.2 mi,  316°
316°
• De Soto Parish
33.8 mi,  102°
102°
• Shelby County
27.5 mi,  159°
159°
• Marion County
43.9 mi,  356°
356°
[0] Calculated by population.us from last known population growth rate, not official data.
[1] County population - 2014, archived from the original, retrieved 02/23/2016
[1b] Annual County Resident Population Estimates by Age, Sex, Race, and Hispanic Origin, (used only data for 2014) archived from the original, retrieved 02/23/2016
[2] County population - 2000-2010, archived from the original, retrieved 02/23/2016
[3] Population of States and Counties of the United States: 1790 to 1992, PDF, 15 Mb, census.gov, retrieved 02/23/2016
[4] County area, latitude longitude data, retrieved 02/23/2016
[5] County boundaries, CSV files on boundaries.us, retrived 03/18/2016
Page generated in 0.016 seconds© 2016 population.us | Terms of use | Contact